1.1 Introduction to Data
Scientists seek to answer questions using rigorous methods and careful observations. These observations — collected from the likes of field notes, surveys, and experiments — form the backbone of a statistical investigation and are called data. Statistics is the study of how best to collect, analyze, and draw conclusions from data. In this first chapter, we focus on both the properties of data and on the collection of data. We will introduce the building blocks of statistical thinking: observations, variables, data frames, and the types of questions that statistics can help us answer.
Key Concepts
- Recognize that a data set consists of cases and variables
- Identify variables as either categorical or quantitative
- Determine explanatory and response variables where appropriate
- Determine whether a study is observational or experimental
Why we collect data
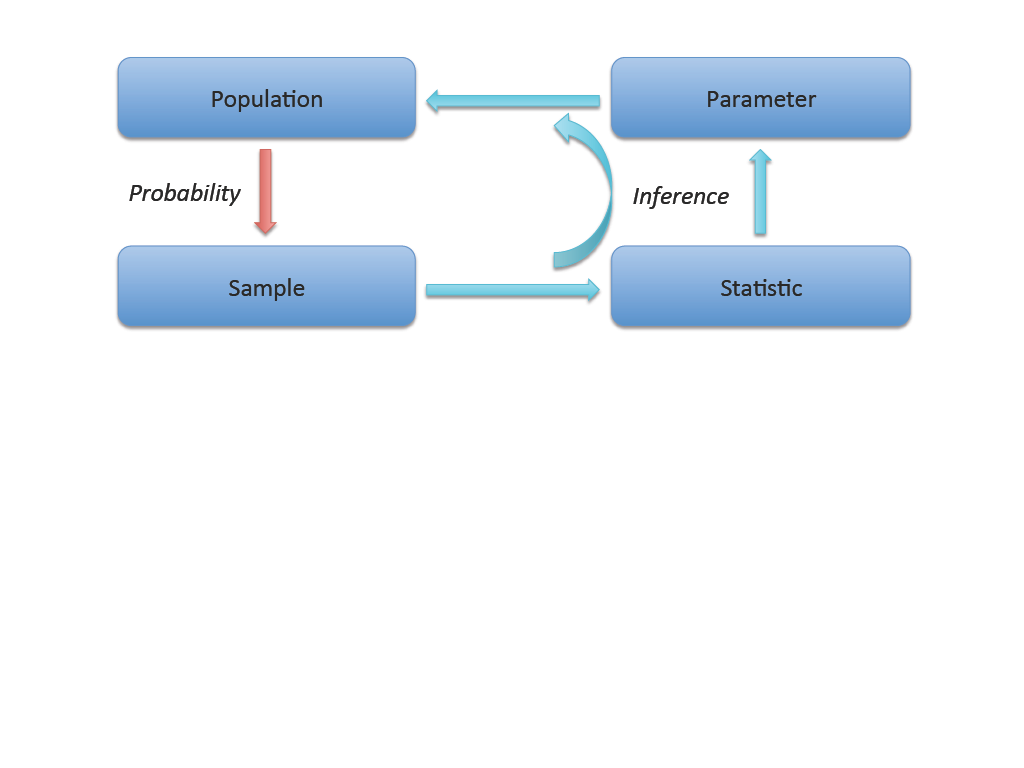
A population is a well-defined collection of all individuals or objects of interest.
A parameter is a number that describes a population and is almost always unknown.
A sample is a subset of the population on which we measure data.
A statistic is a number that describes a sample and is almost always known.
Inference is the process of drawing conclusions about a population parameter from a sample statistic.
All statistical analyses start with a question or an idea. This question or idea is posed about a population, in particular a population parameter. The main purpose of collecting data is to learn about this unknown population parameter. We often cannot measure data for every individual in a population because it would cost too much money or take too long, so a sample, or subset of the population, is collected instead. Using the information in the sample, a statistic is calculated and used to estimate the corresponding population parameter. This process of using a sample statistic to learn about a population parameter is called statistical inference. One of the main goals of this class is to introduce you to the procedures for making statistical inferences in a variety of settings.
Data Basics
A data set, or data frame is used to store the set of measurements taken on individual units.
After data is gathered, it needs a place to be stored. In statistics, this is called a data set, or data frame. Data sets can be as simple as an Excel spreadsheet or as complicated as a major database. It all depends on the complexity of the question.
Structure: Cases and variables
Observations, or Cases, are the subjects/objects that we obtain information about. These are most generally known as experimental units.
A Variable is a characteristic that is measured and recorded for each case.
In general, when data is stored in a table, each row of the table represents an observation, or a case, in the dataset. Each column of the table represents a variable in the dataset.
Note: Many datasets use the first column as an identifier. This would not be considered a variable.
Class Example 1.1.1: Distinguishing between cases and variables
Let’s get to know your classmastes. Find two people near you and ask them the following questions:
- What is your first name?
- What is your major?
- How tall are you?
- How many credit hours are you taking this semester?
- How often do you drink caffeine (never, once a week, few times a week, everyday)?
| Name | Major | Height | Credit Hours | Caffeine |
|---|---|---|---|---|
How many cases are there?
How many variables are there?
Types of Variables
Categorical, or Qualitative variables sort each case into exactly one of two or more non-numerical, non-overlapping categories.
Quantitative variables take on numerical values for each case, often by measuring or counting. Numerical operations like adding and averaging make sense for quantitative variables.
Before we can know how to answer a question, we need to think about the kinds of variables we have recorded. Variables that split cases into groups, called levels, are called categorical, or qualitative, variables. Variables that are numerical quantities are called quantitative variables.
Categorical variables can further be subdivided:
- Nominal variables have levels with no natural ordering. The variable major from Example 1.1.1 is nominal, there is no reason to rank one major over another.
- Ordinal variables have levels with a meaningful order. The variable caffeine has a natural ordering.
Quantitative variables can further be subdivided:
- Continuous variables can take any value within a range, including decimals. The variable height is continous.
- Discrete variables can only take counting values (typically whole numbers: 0, 1, 2, …). The variable credit hours is discrete.
Note: In most of this course, we will treat categorical variables as nominal (unordered) and quantitative variables as continuous. The distinction between nominal and ordinal, and between discrete and continuous becomes more important in advanced courses when special methods are used to take advantage of the ordering.
The ability to identify whether a variable is categorical or quantitative is important because different types of variables are summarized in different ways.
Class Example 1.1.2: Computer ownership at UWL
UWL would like to estimate the proportion of students who own a computer. The university asks 500 students.
- Identify the cases and variable(s) recorded.
- What is the sample?
- What is the population?
- Is the variable categorical or quantitative?
- Identify an unmeasured quantitative variable of interest.
- Is the result of this study a statistic or parameter?
Explanatory and Response Variables
Associated variables show some connection or pattern with one another.
Independent variables have no evident relationship between them.
An explanatory variable is one that helps us understand or predict the value of another variable.
The response variable is the variable that we are trying to understand.
In this class, we will discuss two ways in which data are used to answer questions. The first is looking only at a single variable, and the second is to determine if there is a relationship between two variables. When two variables show some connection or pattern with one another, they are called associated variables (or related variables). If two variables are not associated, there is no evident relationship between them. The two variables are said to be independent.
In studies that look for an association, many times we want to know if one variable explains the behavior of another variable. In this kind of study, the explanatory variable would explain the behavior in the response variable.
Class Example 1.1.3: Explanatory and response variables
For the following research questions, identify the explanatory variable and the response variable.
- Does eating yogurt cause people to lose weight?
- Does meditation help reduce stress?
- Is hyperactivity in children affected by sugar consumption?
Class Example 1.1.4: 2023 Hollywood Movies
Here is a small part of a dataset that includes information on all 136 movies to come out of Hollywood in 2023. “Rating” is audience rating on a 100-point scale, “Budget” is budget in millions of dollars, and “Opening” is opening weekend gross, in millions of dollars.
| Title | Lead Studio | Rating | Genre | Budget | Opening |
|---|---|---|---|---|---|
| Oppenheimer | Atlas | 93 | Biography | $100 | $82 |
| Barbie | Warner Bros | 88 | Comedy | $145 | $162 |
| Spider-Man: Across the Spider-Verse | Sony | 95 | Action | $100 | $120.5 |
| Guardians of the Galaxy Vol. 3 | Disney | 82 | Sci-fi | $250 | $118 |
| The Holdovers | Focus | 97 | Drama | $13 | $2.7 |
| Killers of the Flower Moon | Paramount | 93 | Drama | $200 | $23 |
- What are the cases in this dataset?
- What are the variables in this dataset? For each variable, identify whether it is categorical or quantitative.
Name a question we might ask about this dataset that is about
- a single variable
- a relationship between two of the variables
Observational Studies and Experiments
In an experiment the researcher actively controls one or more of the explanatory variables.
In an observational study the researcher simply observes the values as they naturally exist.
Two variables are associated when the values of one tend to move with the values of the other.
Two variables are causally associated when changing one of them actually changes the other.
There are two primary types of data collection: experiments and observational studies. Understanding the difference is critical, because the type of study determines what conclusions we can draw.
If the researcher is only observing what happened, the study is an observational study. In statistics, the word observational does not mean that the researcher is watching the participant do every part of the study. Instead, observational refers to the fact that the researcher takes a dataset and makes observations about the data in the set. If the researcher is actively involved with assigning different values of the explanatory variable to the participants, then the study is an experiment. In general, observational studies can provide evidence of a naturally occurring association between variables, but they cannot by themselves show a causal connection. This is because in observational studies, researchers cannot control for all the other variables that might be influencing the outcome.
Warning: Association does not imply causation.
Class Example 1.1.5: Experimental or Observational Studies
Determine whether each of the following is an experiment or an observational study:
- A pharmaceutical company randomly assigns 200 patients to receive either a new drug or a placebo and measures their cholesterol levels after 6 months.
- A university surveys its graduates to determine whether those who participated in study-abroad programs earn higher salaries five years after graduation.
- A teacher assigns students in her morning class to use a new learning app and students in her afternoon class to study using traditional methods, then compares exam scores.
Summary
This chapter introduced you to the world of data. Here are the key ideas:
- Data are observations collected about the world around us. Statistics is the science of collecting, analyzing, and drawing conclusions from data.
- A data set, or data frame, organizes data so that each row represents an observation and each column represents a variable.
- Variables come in two fundamental types: quantitative (continuous or discrete) and categorical (nominal or ordinal).
- The explanatory variable is the variable we think might influence the response variable.
- Experiments randomly assign subjects to treatments and can establish causation. Observational studies merely observe what happens and can identify associations, but generally cannot establish causation.
- Association does not imply causation — this is one of the most important principles in statistics.
Many of the ideas from this chapter will be revisited as we move on to doing end-to-end data analyses. In the next chapter, you will learn about how we can design studies to collect the data we need to make conclusions with the desired scope of inference.