6 Sampling Variability
In 2017, 17,442 runners finished the Cherry Blossom Ten Mile Run in Washington, DC. Their average time was 97.8 minutes, and 60% of them were women. Usually you can’t see everyone. You have a sample, say 30 runners’ times, and your sample’s average won’t be exactly 97.8. How far off would it be? And what would another 30 runners give you?
Every result would come out differently with new data. This chapter asks how differently, using a population we can see in full, and builds the words for it: parameter and statistic, sampling distribution, standard error. From the next chapter on, we ask the same question about data whose population is out of sight.
Two quick experiments: how good is your intuition about randomness?
- Are You Psychic? — predict a series of coin flips, see your score, then watch the tool simulate hundreds of random guessers. How impressive is your result compared to pure chance?
- Stump the Chump — type an H/T sequence you think “looks random,” then compare it to a truly random sequence. Run lengths, alternation rates, and the longest run will tell you whether human-generated “randomness” is too even.
Both are short. Real random samples vary more than people expect, and that variability has a predictable shape: the subject of this chapter.
6.1 Parameters vs. statistics
When we collect data, we typically have a larger group in mind. A political poll surveys 1,000 likely voters, but the real interest is in all voters. A quality engineer measures 50 widgets from an assembly line, but the real interest is in all widgets the line produces. The larger group is the population; the subset we actually observe is the sample. The 17,442 Cherry Blossom finishers are a population; any 30 of them would be a sample.
A population parameter is a numerical summary of the entire population. It is a fixed number, but it is almost always unknown because we cannot observe the whole population.
A sample statistic (also called a point estimate) is a numerical summary computed from sample data. It is our best guess at the population parameter. Because the statistic is computed from a sample, it is known — but it changes from sample to sample.
We use specific notation to distinguish parameters from statistics:
| Quantity | Parameter (population) | Statistic (sample) |
|---|---|---|
| Proportion | \(p\) | \(\hat{p}\) |
| Mean | \(\mu\) | \(\bar{x}\) |
| Standard deviation | \(\sigma\) | \(s\) |
| Difference in proportions | \(p_1 - p_2\) | \(\hat{p}_1 - \hat{p}_2\) |
| Difference in means | \(\mu_1 - \mu_2\) | \(\bar{x}_1 - \bar{x}_2\) |
The “hat” notation (\(\hat{p}\)) is a common convention: it signals that we are estimating the corresponding parameter.
A medical consultant has facilitated 62 liver donor surgeries, and 3 of her patients experienced complications. She uses this track record to attract new patients.
Let \(p\) represent the true complication rate for liver donors working with this consultant. What is the point estimate \(\hat{p}\)?
The sample proportion is \(\hat{p} = 3/62 = 0.048\). That is, about 4.8% of her patients experienced complications. This is our point estimate of the true complication rate \(p\).
A Stanford University graduate student recruited 120 tappers and 120 listeners for a study on communication. Only 3 out of 120 listeners were able to guess the tune being tapped. What is the point estimate \(\hat{p}\) for the true proportion of listeners who can guess correctly?
Show answer
The point estimate is \(\hat{p} = 3/120 = 0.025\), or 2.5%. This is our best single estimate of the true proportion \(p\) of listeners who can guess the tune.In a study of sex discrimination, 48 male bank supervisors each reviewed a personnel file and decided whether the candidate should be promoted. The files were identical except that half listed the candidate as male and half as female. The results are summarized below:
| Promoted | Not promoted | Total | |
|---|---|---|---|
| Male | 21 | 3 | 24 |
| Female | 14 | 10 | 24 |
| Total | 35 | 13 | 48 |
What is the point estimate for the difference in promotion rates between male and female candidates?
The promotion rate for male candidates is \(\hat{p}_M = 21/24 = 0.875\) and for female candidates is \(\hat{p}_F = 14/24 = 0.583\). The point estimate of the difference is:
\[\hat{p}_M - \hat{p}_F = 0.875 - 0.583 = 0.292\]
The observed difference is 29.2 percentage points in favor of male candidates. Could a gap that size come from nothing more than the luck of which supervisors got which file? The randomization tests chapter answers that question, with this study.
A point estimate is almost never exactly equal to the population parameter. This is not because we did anything wrong — it is an inherent consequence of working with a subset of the population. The critical question is: how far off might the estimate be?
6.2 Sampling distributions
To see how far a statistic might be from its parameter, we need many samples from the same population. Usually that’s impossible. With the Cherry Blossom runners it isn’t, because we have all of them.
The parameter: 0.599 of the finishers were women, so \(p = 0.60\) to two decimals. Draw 50 runners at random and count the women. Our first draw had 32 women, so \(\hat{p} = 32/50 = 0.64\). A second draw of 50 had 29 (\(\hat{p} = 0.58\)), and a third had 31 (\(\hat{p} = 0.62\)).
Each draw gave a different \(\hat{p}\), and none of them is 0.60. Nothing went wrong: this is sampling variability.
Now imagine hundreds of people each drawing their own 50 runners. A histogram of all their \(\hat{p}\)’s is the sampling distribution of \(\hat{p}\).
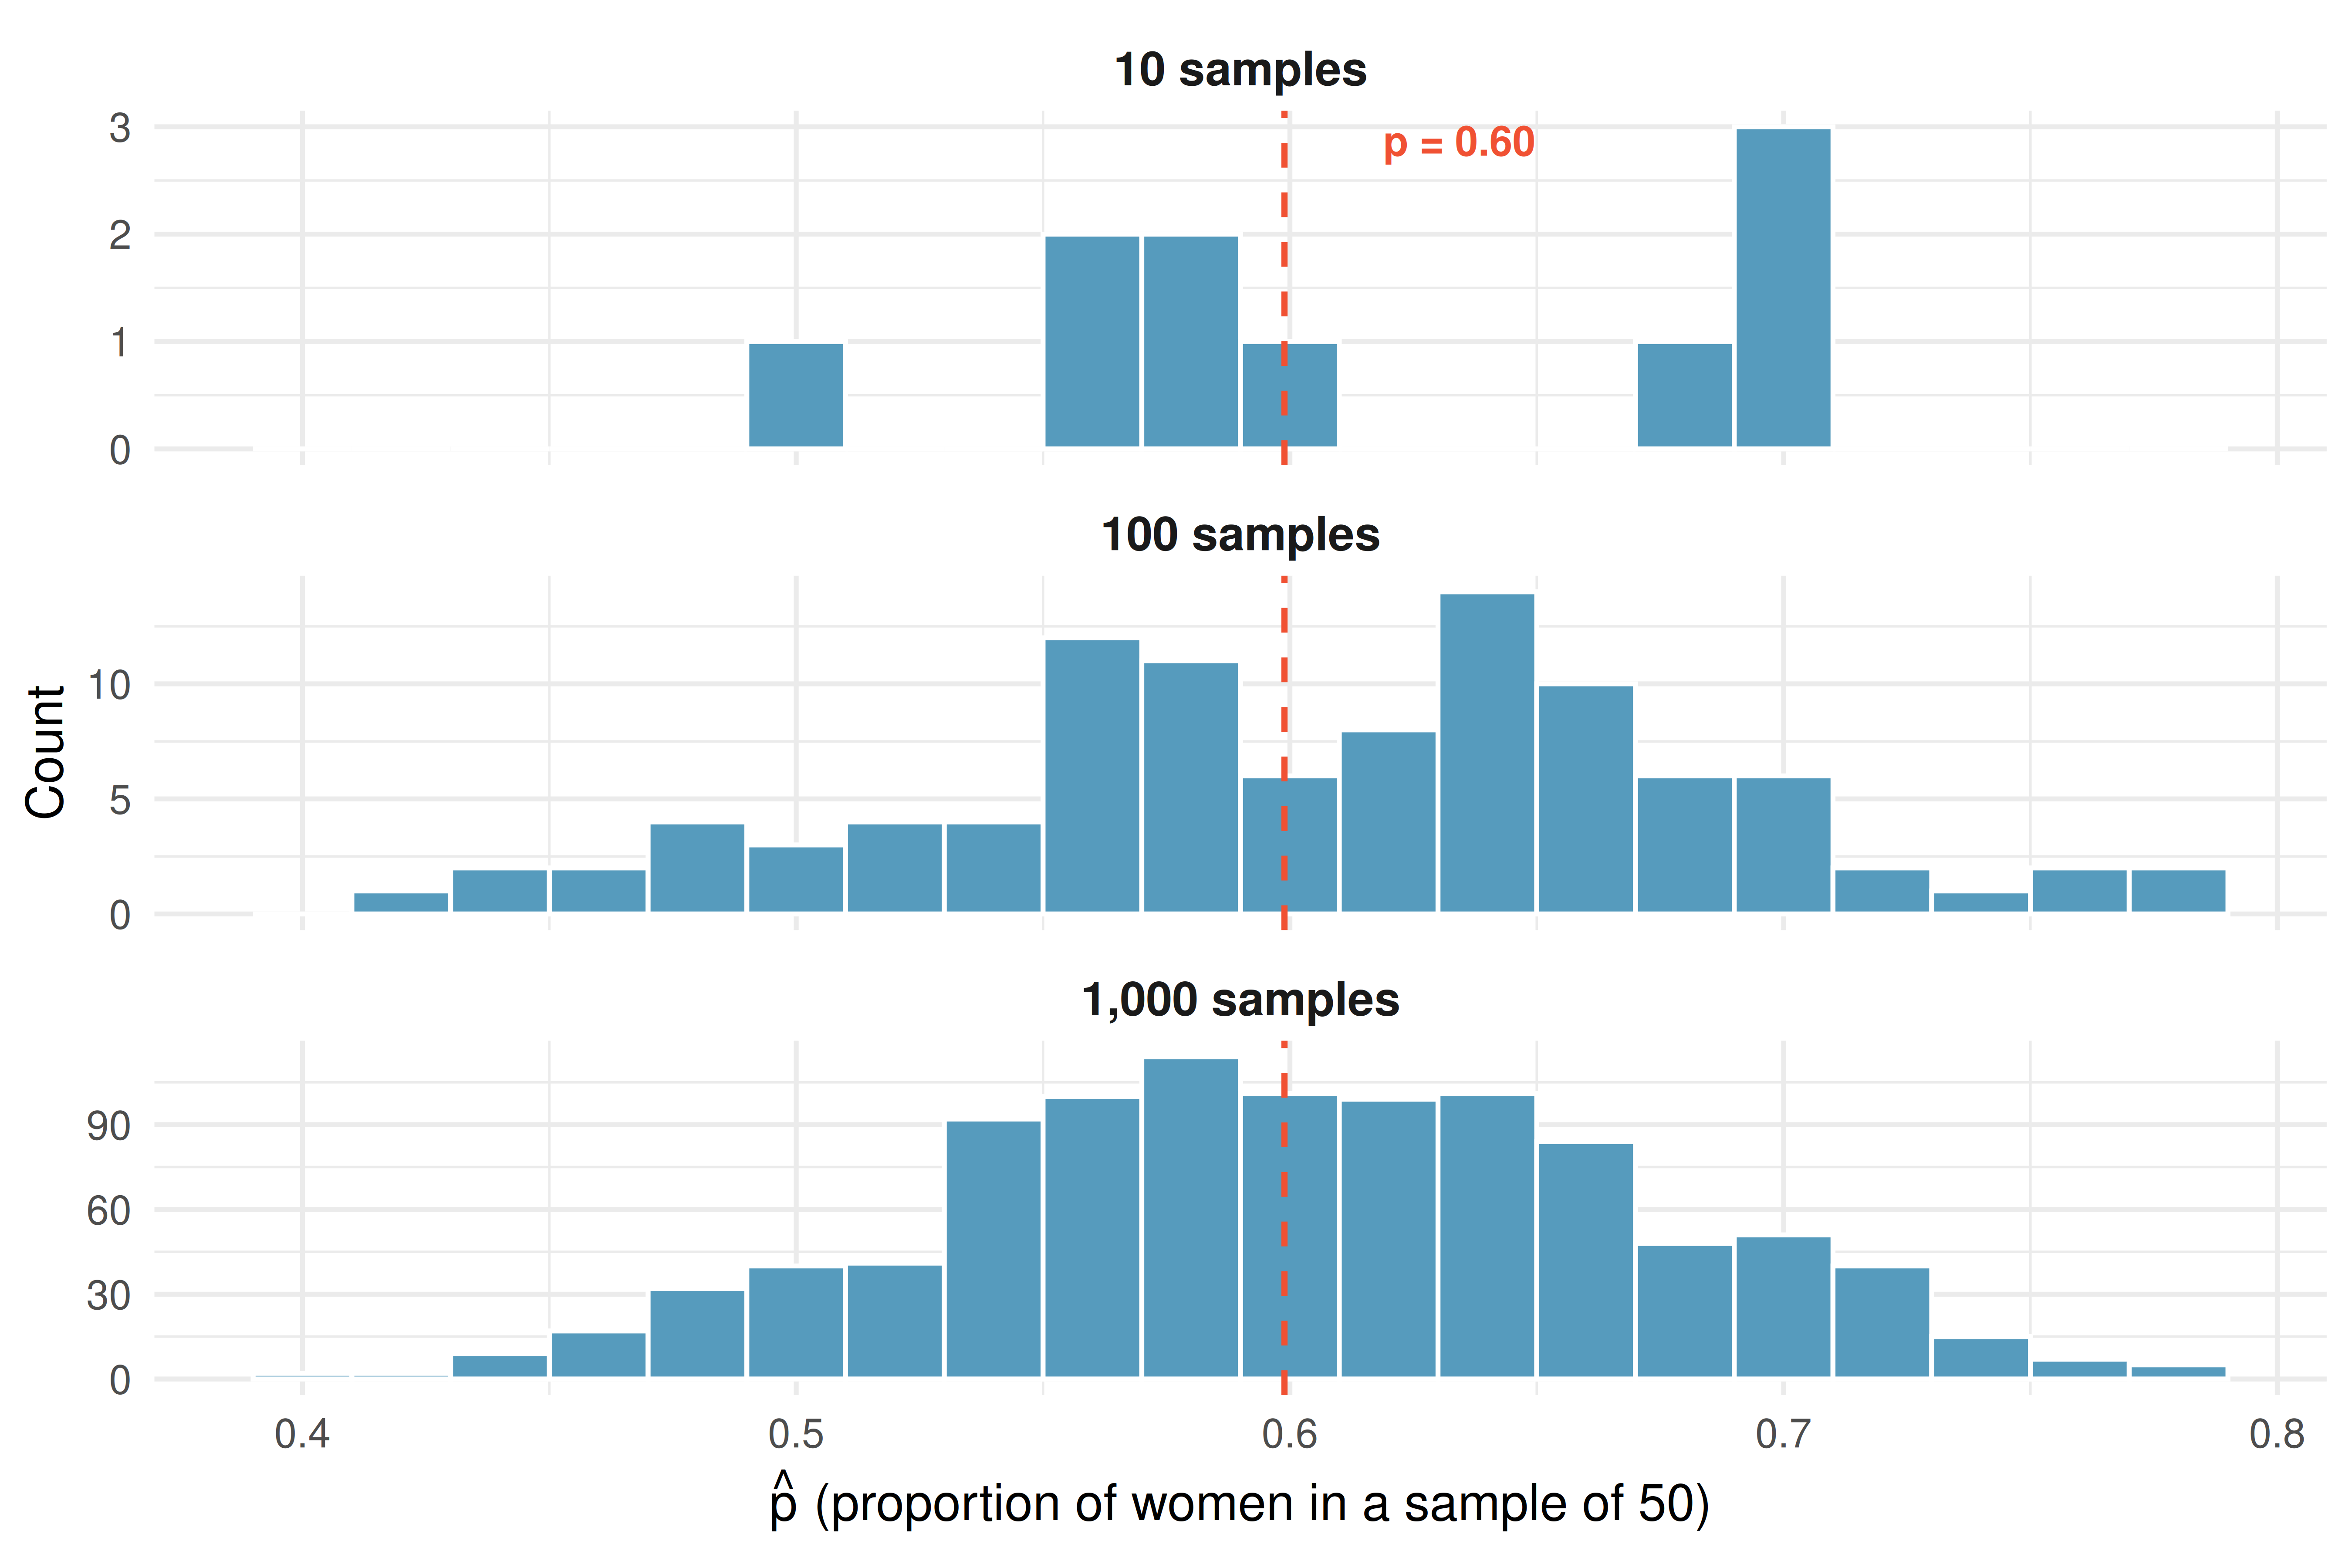
Predict before you look. If 1,000 people each drew 50 runners, where would most of their \(\hat{p}\)’s land? Would any come out below 0.50, a sample with more men than women, even though 60% of the runners are women?
Show answer
Most land near 0.60, the parameter; the three draws above already hint at it. A few do fall below 0.50: 62 of the 1,000 samples in Figure 6.1 did. A sample drawn honestly can still point the wrong way.
The sampling distribution of a statistic is the distribution of all possible values of that statistic computed from all possible samples of a given size from a given population.
A sampling distribution is not the distribution of individual data values. It is the distribution of a sample statistic (like \(\hat{p}\) or \(\bar{x}\)) across many hypothetical samples.
An analogy helps keep the two pictures apart. You want to know the average depth of a lake.
- One boat, one sample. A boat measures the depth at 10 random spots. Those 10 depths form a data distribution: how depth varies from spot to spot. Their average is one sample statistic.
- A fleet of boats, a sampling distribution. A fleet of 100 boats each measures 10 random spots of its own and reports only its average. The 100 averages form the sampling distribution of the mean.
The spots must be random: a boat that stays in one bay all day gives a biased sample, as in the study design chapter. And the two pictures describe different things:
- The data distribution shows how individual observations vary.
- The sampling distribution shows how a statistic (like the mean) varies from sample to sample.
Which of the two would you expect to be wider? We check on the runners in Section 6.4.
6.3 Variability of sample statistics
Different samples from the same population produce different statistics. This variability is not a flaw — it is a fundamental feature of sampling that we must understand and measure.
Suppose 52% of all US adults support a particular policy. A polling firm asks a random sample of 1,000 adults and reports its \(\hat{p}\). What if 1,000 firms each ran that poll, every one of them done correctly?
We simulated it. The 1,000 results ran from 0.47 to 0.57, and 92 of them came in below 0.50, reporting a minority where there is a majority. No firm made a mistake. That is sampling variability: the unavoidable variation that comes from estimating a population parameter with a sample.
Predict. If each of those firms had polled 10,000 adults instead of 1,000, would their \(\hat{p}\)’s be closer together or farther apart? Why?
Show answer
Closer together. A bigger sample carries more information about the population, so the statistic moves less from one sample to the next. Figure 6.2 shows how much less.6.3.1 What determines how much a statistic varies?
Figure 6.2 goes back to the runners and draws 1,000 samples at each of three sizes.
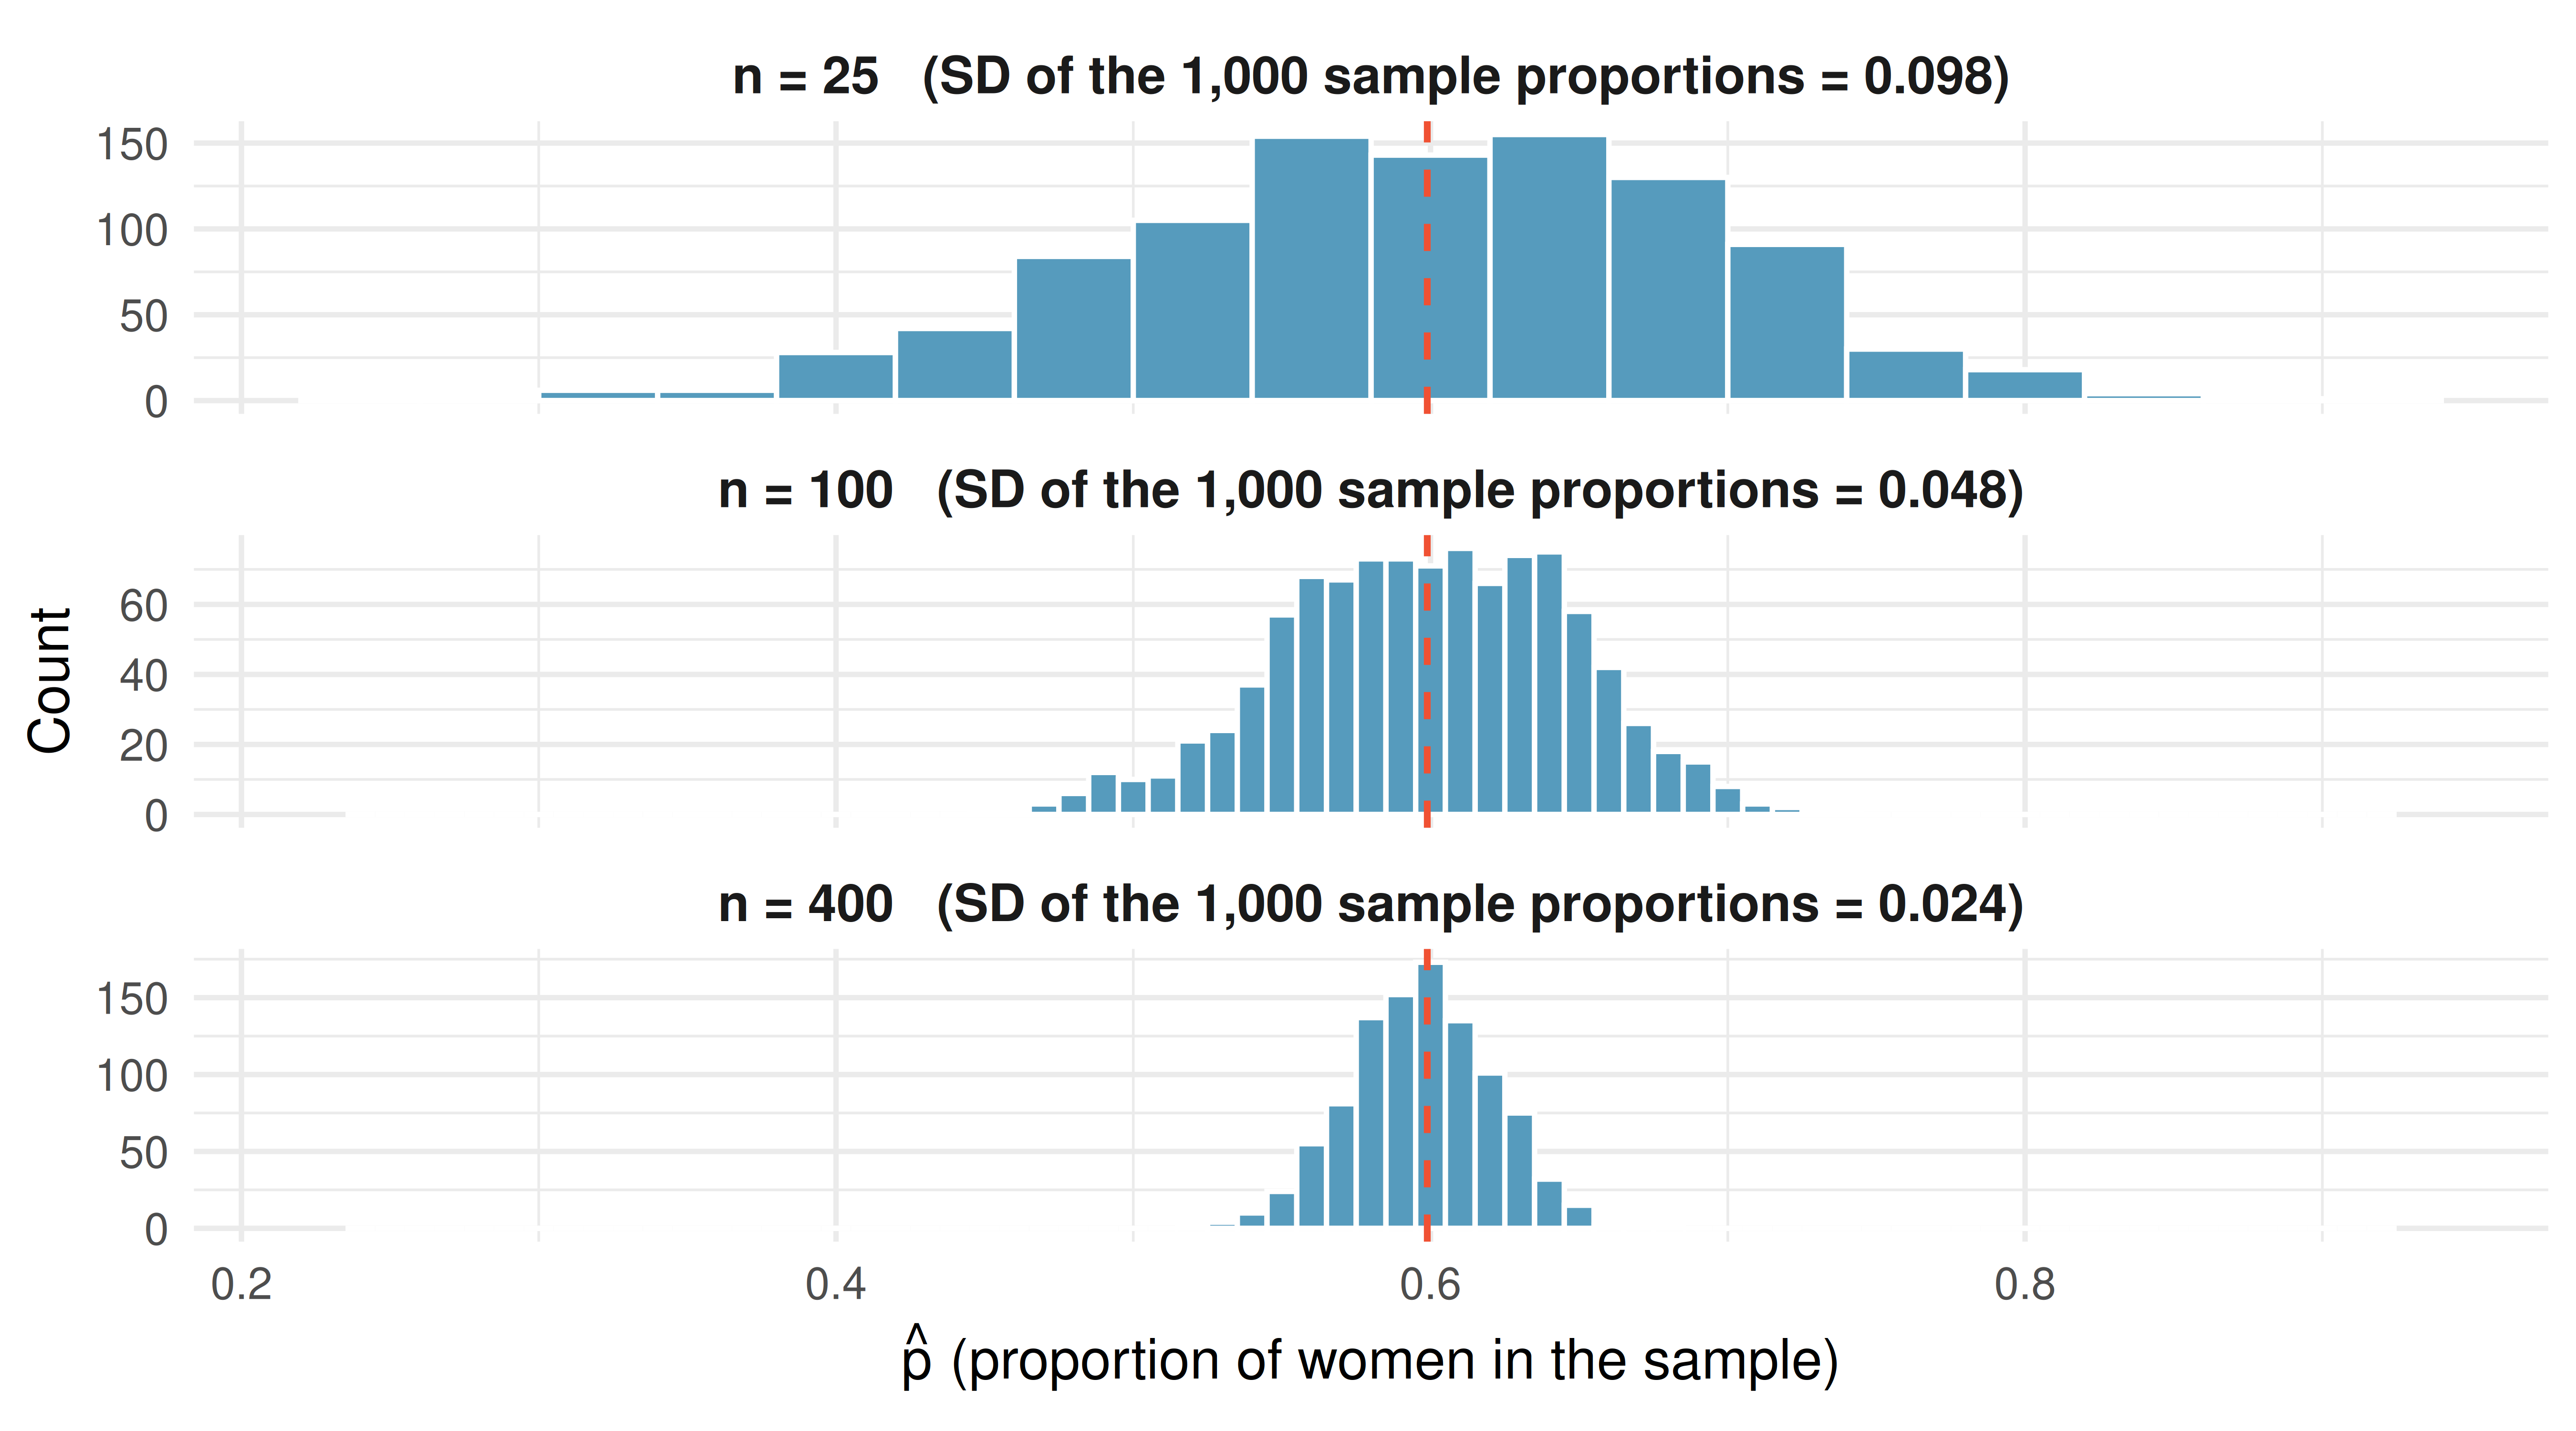
Read the spreads off the figure. With samples of 25 runners, the middle 95% of the sample proportions run from 0.40 to 0.76; with samples of 400, from 0.55 to 0.64. The standard deviations are about 0.10, 0.05 and 0.024: each time the sample size is multiplied by 4, the spread is cut roughly in half. Halving the spread takes four times the data, not twice.
Two things control how much a statistic moves from sample to sample:
- Sample size (\(n\)). Larger samples produce statistics closer to the parameter, as the figure shows.
- Variability in the population. If everyone in the population is similar, every sample looks alike and the statistic barely moves. If individuals differ a lot, samples can differ a lot too.
Of the two, sample size is the one we control.
Predict → Do → Explain. The runners’ proportions piled up at their parameter. Do sample means do the same, even from a lopsided population?
- Predict. The Sampling Distribution Lab activity starts from a strongly right-skewed population: most values low, a long tail of large ones. If you take hundreds of samples of 10 and plot each sample’s mean, where will the means pile up: at the population mean \(\mu\), to the right of \(\mu\) toward the tail, or spread evenly?
- Do. Follow the activity: draw a few samples one at a time, then 1,000. Freeze that picture, change \(n\) to 100, and draw 1,000 more.
- Explain. Why didn’t the long tail drag the means to the right? Which change made the distribution narrower: more samples, or bigger samples?
Your answers save in the tool, on this device.
Self-check
At \(n = 10\) the means pile up at \(\mu\), and the picture is already less skewed than the population. At \(n = 100\) it is much narrower and close to bell-shaped. The center stays at \(\mu\) because averaging has no built-in lean: over many samples, the means that come out too high balance the ones that come out too low. More samples only fill in the same picture; bigger samples make a different, narrower one, and the SD readout at \(n = 100\) is about a third of the one at \(n = 10\). Why averages end up bell-shaped is the subject of the sampling distributions chapter.
What the simulations show. For the statistics in this course, the sampling distribution has three features:
- Center: at the parameter. The statistic has no built-in lean toward values that are too high or too low.
- Spread: smaller for larger samples. Drawing more samples fills in the picture but doesn’t narrow it; larger samples do.
- Shape: often roughly bell-shaped, more so as the sample size grows. The sampling distributions chapter says when and why.
6.4 Standard error
We need a single number for how much a statistic varies from sample to sample. That number is the standard error.
The standard error (SE) of a statistic is the standard deviation of its sampling distribution. It measures the typical distance between a sample statistic and the population parameter. In this part of the book we find it by simulation: draw many samples, compute the statistic each time, and take the standard deviation of those values.
A small standard error means the statistic tends to fall close to the parameter (a precise estimate). A large standard error means the statistic could easily fall far from the parameter (an imprecise estimate).
The standard deviations printed on the panels of Figure 6.2 are standard errors: about 0.10 for samples of 25 runners, 0.05 for 100, and 0.024 for 400.
Predict. Think back to the lake. Which is more spread out: the times of individual runners, or the averages of samples of 30 runners? By a little, or by a lot?
Show answer
By a lot. Individual times have a standard deviation of about 16.9 minutes; averages of 30 runners have a standard deviation of about 3.1 minutes, roughly a fifth as much (Figure 6.3). Averaging pulls in the extremes: a sample of 30 almost always mixes fast runners with slow ones.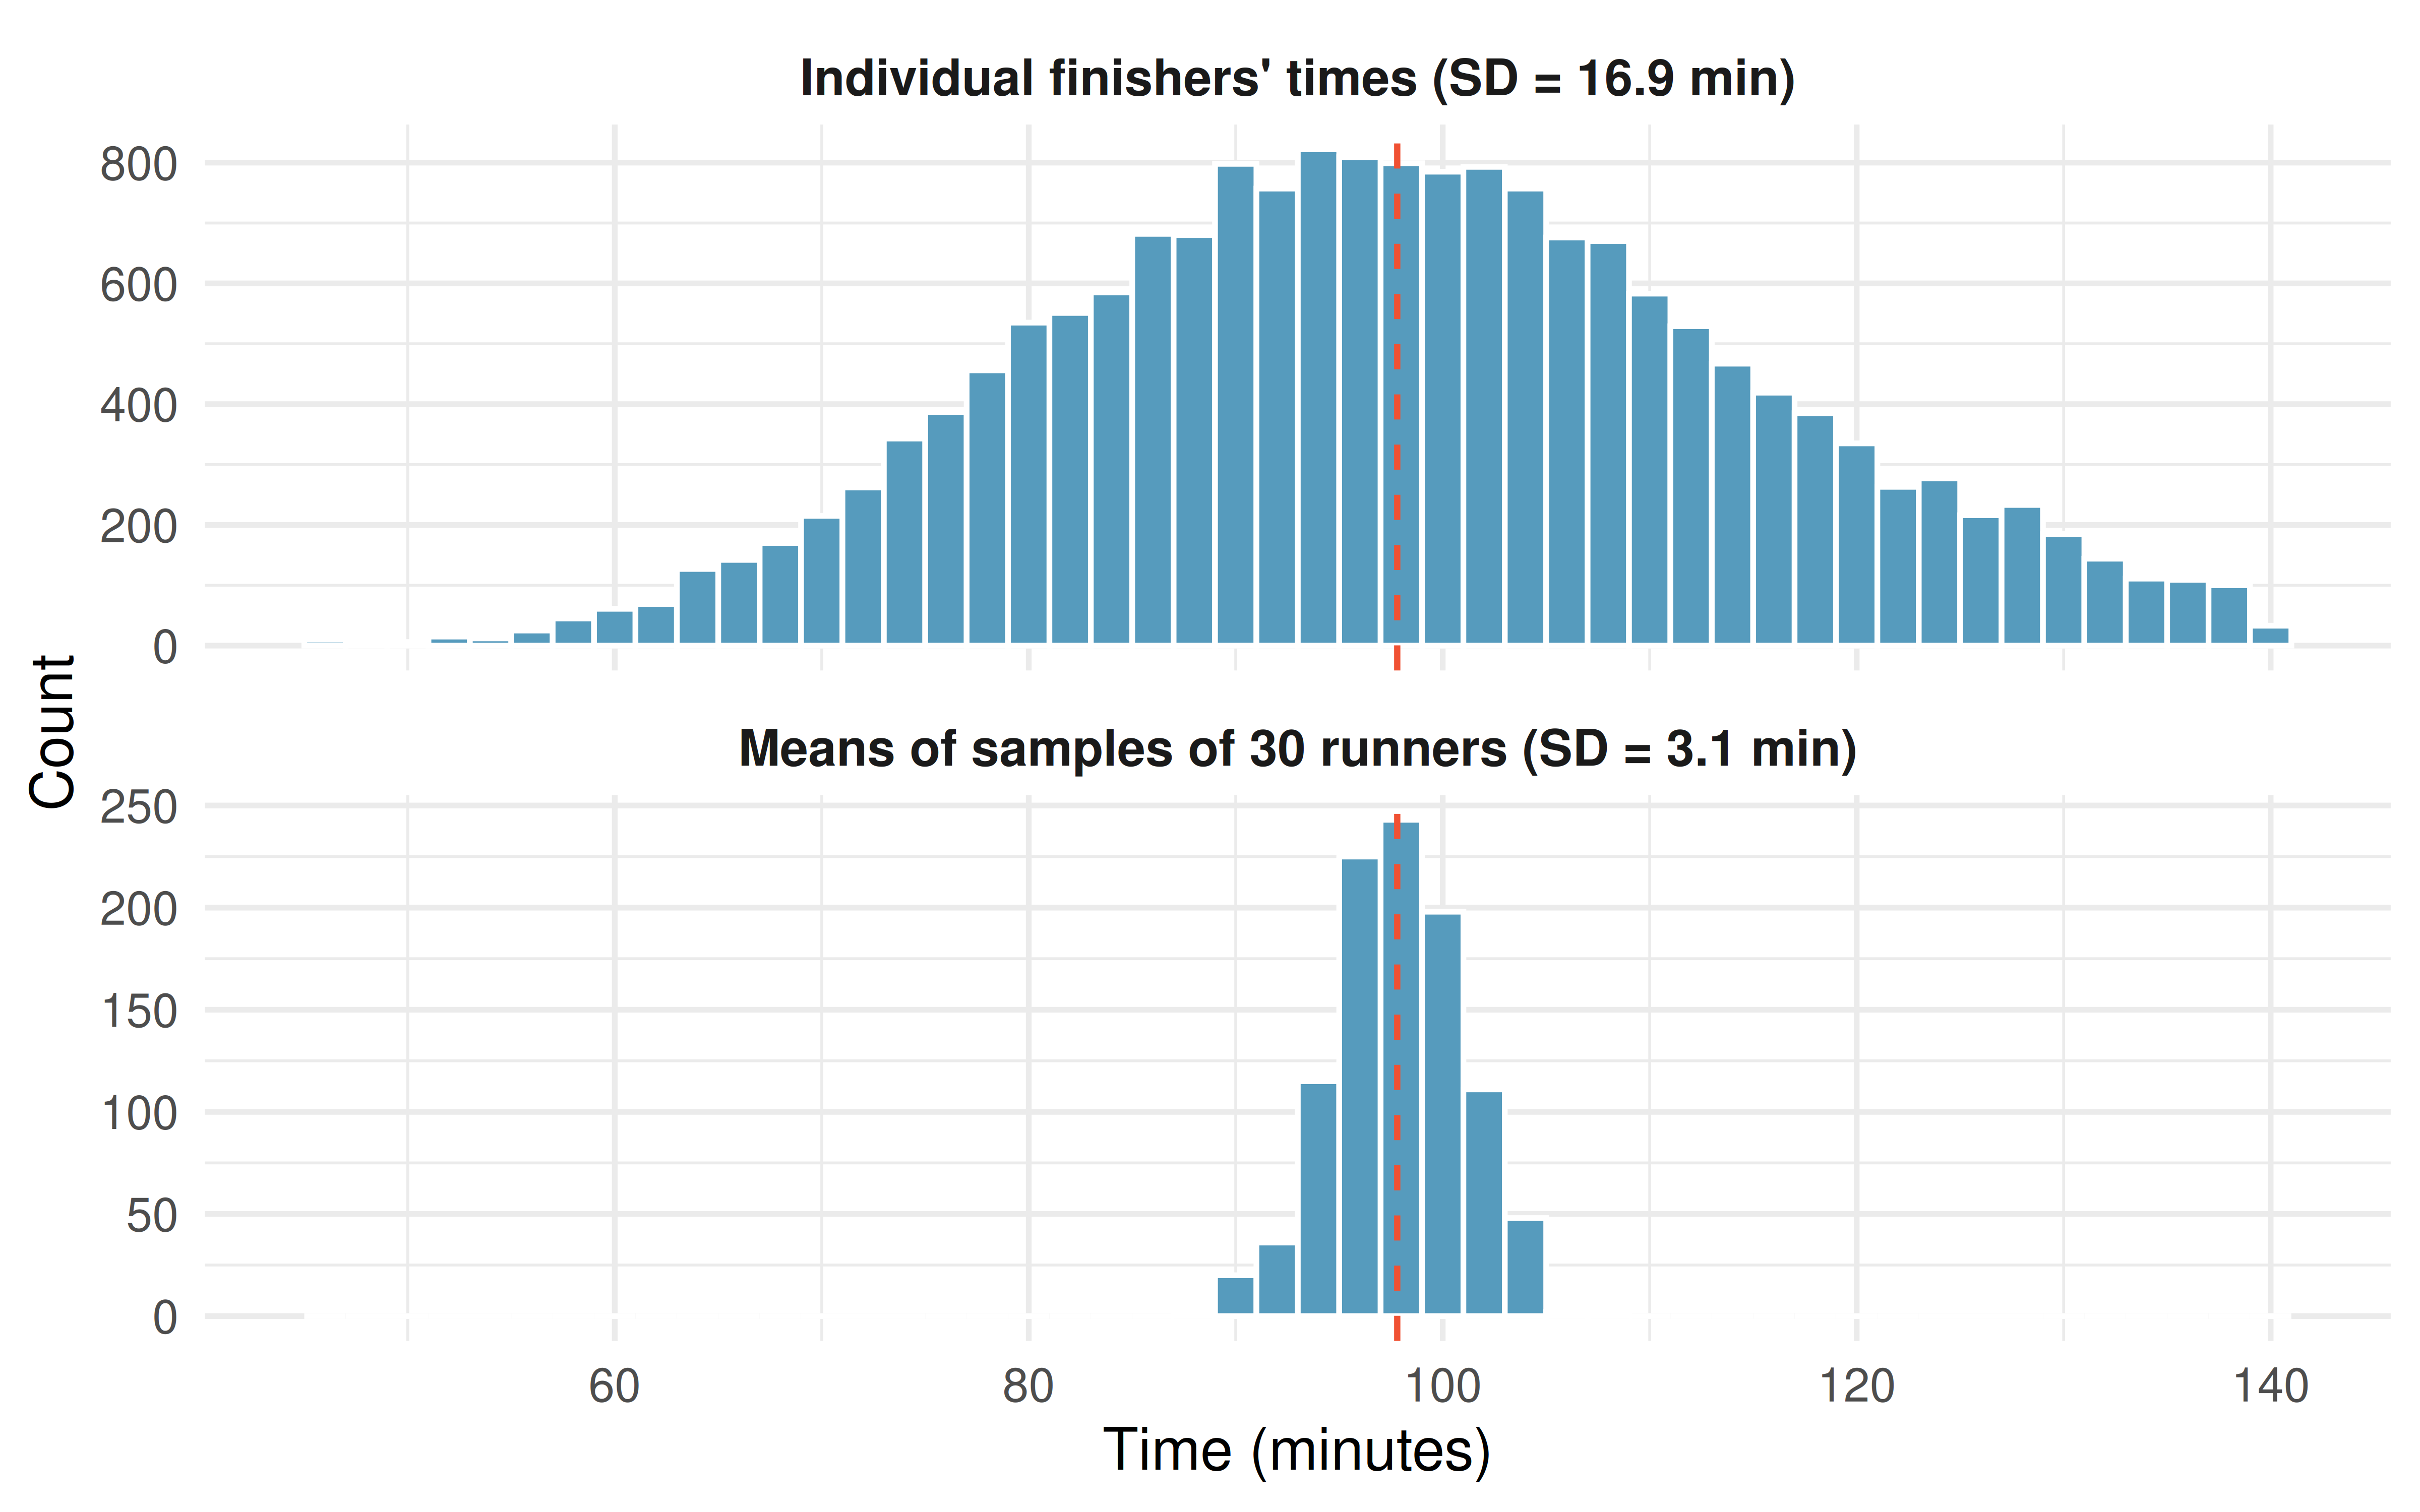
In Figure 6.3, individual times vary with a standard deviation of about 16.9 minutes, while the means of 30 runners vary with a standard deviation of about 3.1 minutes. That second number is the standard error of \(\bar{x}\) for samples of 30: a sample mean is typically about 3 minutes from \(\mu = 97.8\).
Do not confuse the standard error with the standard deviation of the data:
- The standard deviation (\(s\) or \(\sigma\)) measures how much individual observations vary around the mean.
- The standard error (SE) measures how much a sample statistic varies around the population parameter from sample to sample.
For a mean, the standard error is smaller than the standard deviation (for samples larger than \(n = 1\)) because averaging reduces variability.
In the medical consultant example, \(\hat{p} = 3/62 = 0.048\). What is the standard error of \(\hat{p}\), and how could we find it?
The standard error is the standard deviation of the \(\hat{p}\)’s we would get if we could rerun her practice many times, 62 patients each time. With the runners we drew sample after sample, because we had the whole population. Here we don’t: all we have is her one sample of 62 patients. Finding a standard error when all you have is your sample is the job of the bootstrap chapter, which draws new samples from the sample itself.
6.4.1 Why the standard error matters
Every method in this book answers the question what if we did it again?, and the standard error is the size of the answer: how far a statistic typically moves from one sample to the next. The next chapters use the spread of simulated statistics in three ways:
- Tests (randomization tests chapter): is our result out in the tail of what chance produces, or in the bulk?
- Intervals (bootstrap chapter): which values of the parameter are within the typical spread of our estimate?
- Shortcuts (sampling distributions chapter): formulas that predict the spread without simulating.
Until the last of those, we get the spread the way this chapter did: by simulating.
Two researchers both estimate the proportion of college students who prefer online textbooks. Researcher A surveys 100 students and finds \(\hat{p}_A = 0.62\); a simulation gives a standard error of \(SE_A = 0.049\). Researcher B surveys 400 students and finds \(\hat{p}_B = 0.58\), with \(SE_B = 0.025\).
- Whose estimate is more precise? How do you know?
- Why is Researcher B’s standard error smaller?
Show answer
- Researcher B’s estimate is more precise because the standard error is smaller (0.025 < 0.049), meaning the sample statistic is expected to be closer to the true parameter. (b) Researcher B surveyed four times as many students, and increasing the sample size reduces the standard error: four times the data cut it roughly in half, just as in Figure 6.2.
6.5 A complete example: shrinking counties
Between 2010 and 2017, did most US counties lose population? Suppose you can’t get the full census table, only 40 counties picked at random. How much would your answer depend on which 40 you got?
Step 1: Name the population and the parameter. The population is all 3,139 US counties with population figures for both years. The parameter \(p\) is the proportion of them whose population fell between 2010 and 2017. In real life \(p\) would be unknown. Here we have every county, so we can check our work: \(p = 0.508\), just over half.
Step 2: Take one sample and compute the statistic. Our random sample of 40 counties had 21 that shrank: \(\hat{p} = 21/40 = 0.525\).
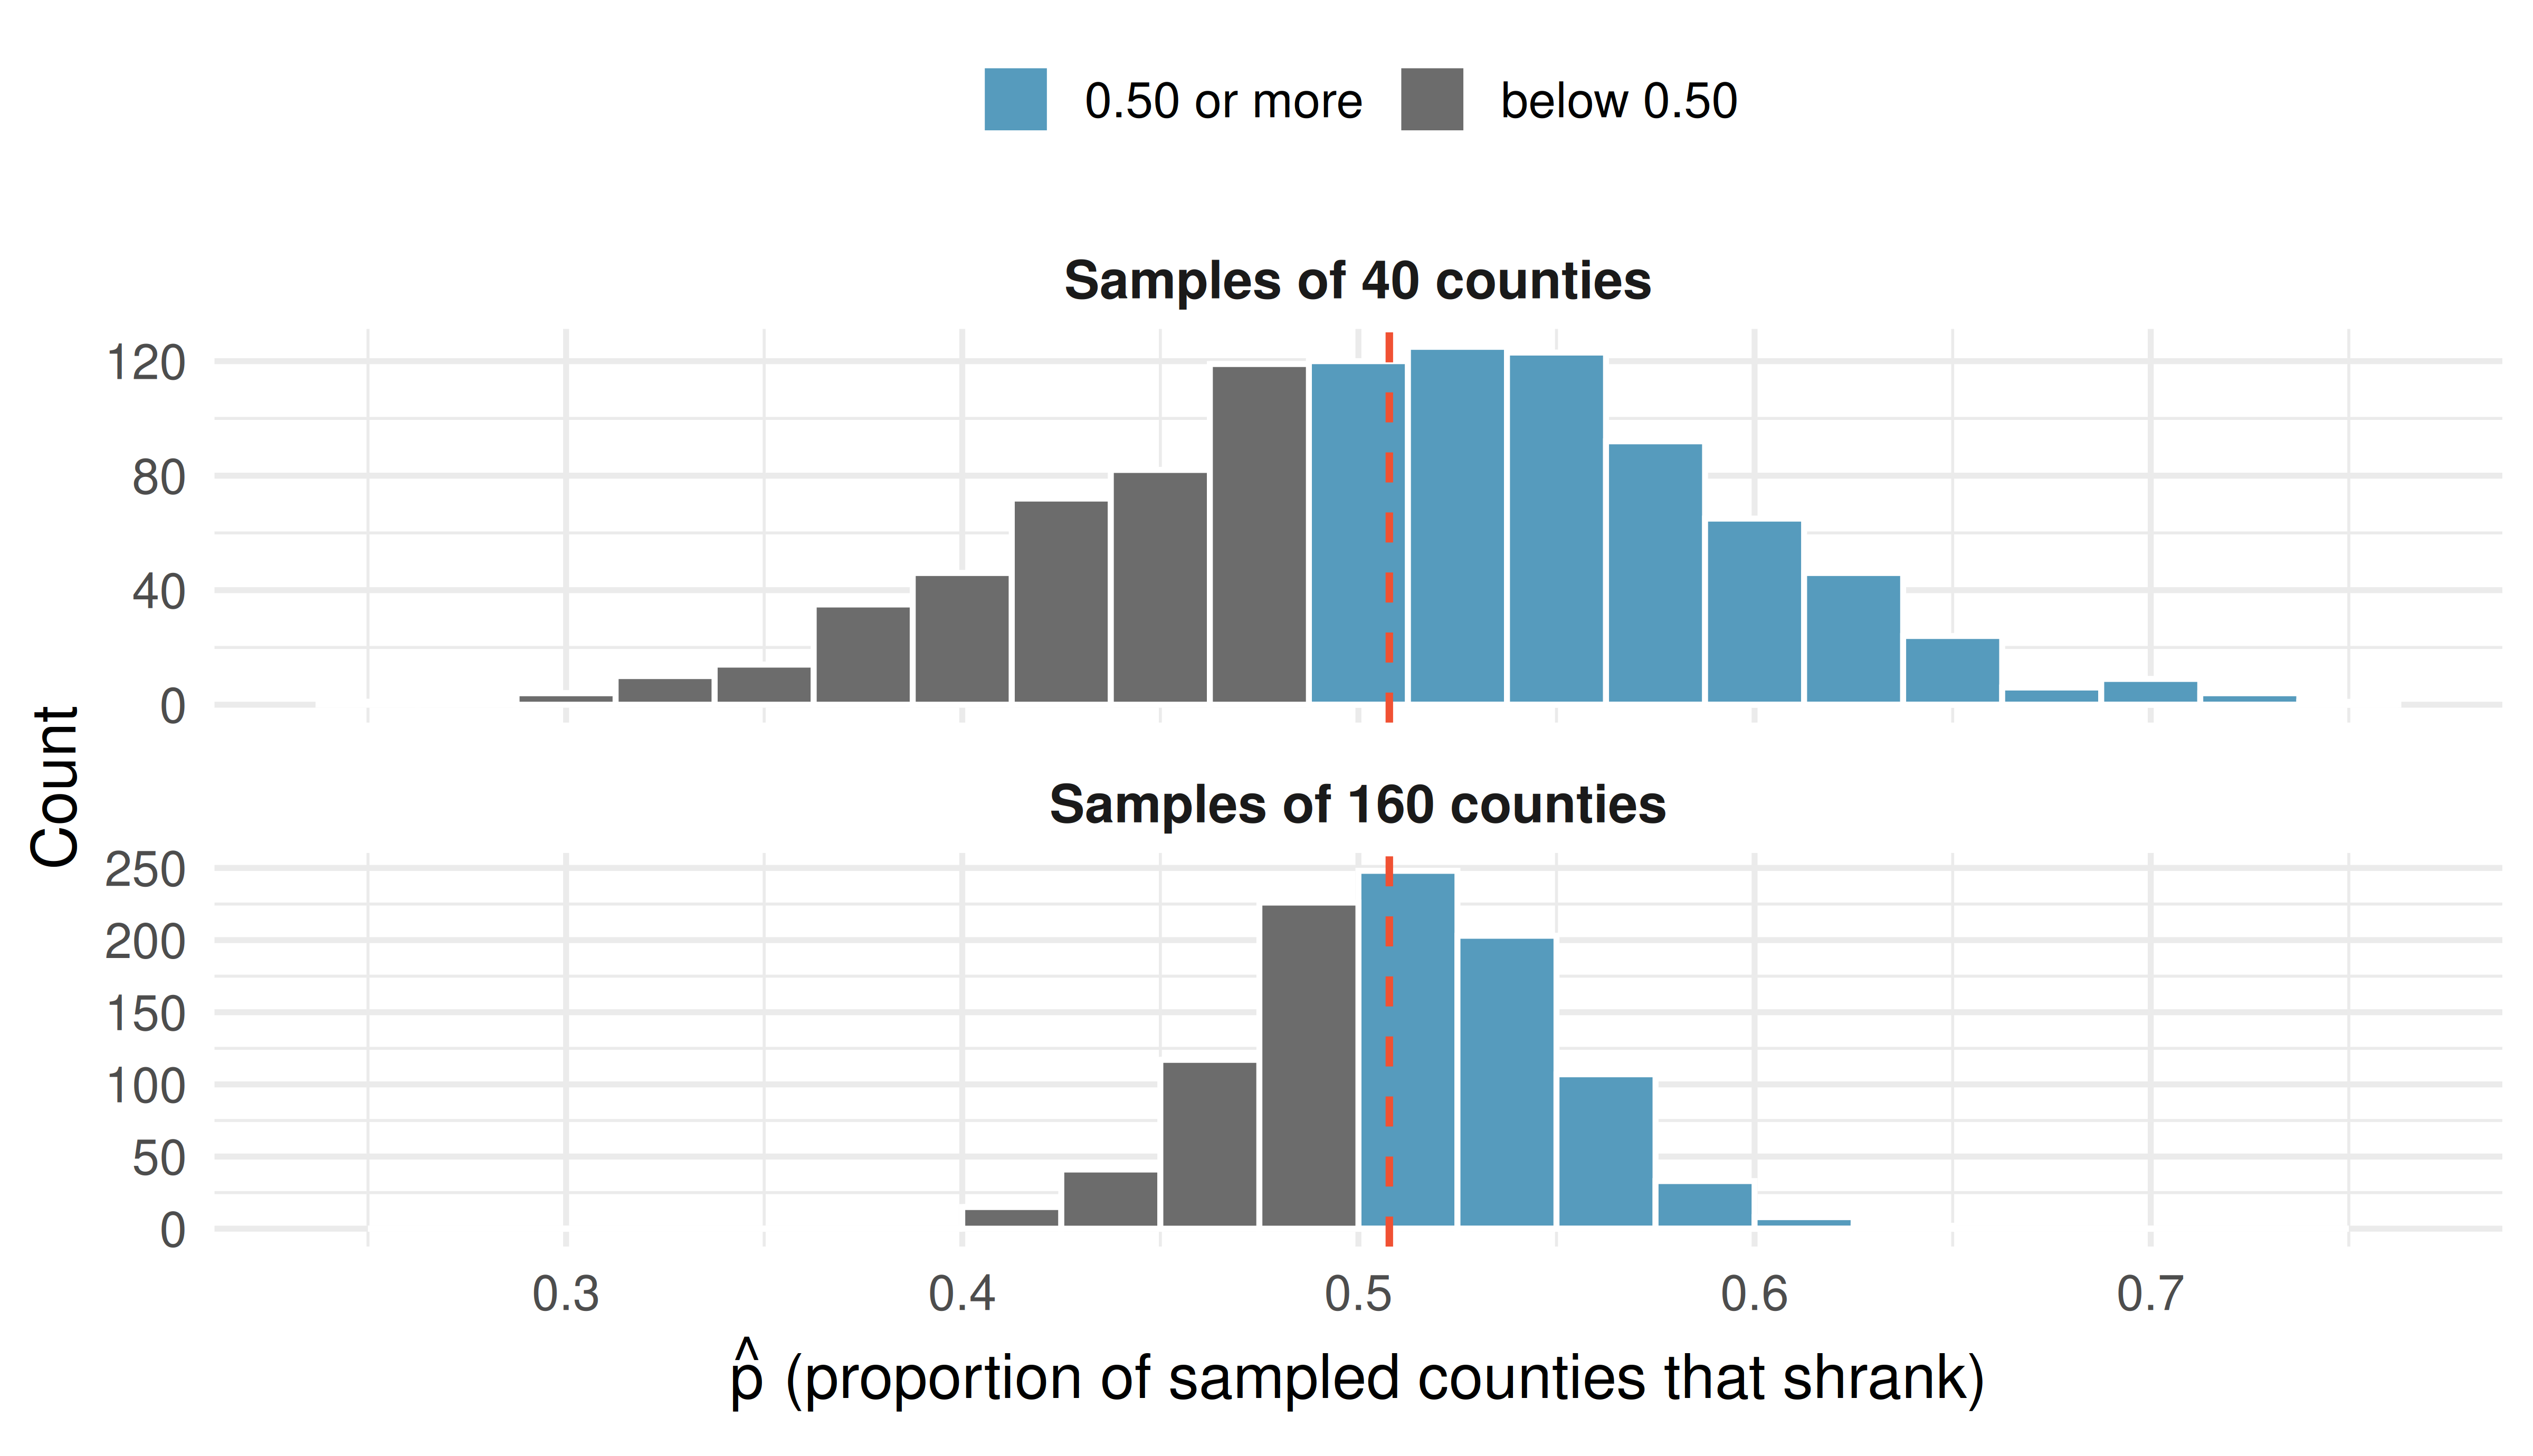
Step 3: What if we did it again? Draw 1,000 random samples of 40 counties and compute \(\hat{p}\) for each (Figure 6.4, top).
Step 4: Read the sampling distribution.
- Center: about 0.51, at the parameter.
- Spread: the standard deviation of the 1,000 \(\hat{p}\)’s, the standard error, is about 0.08. The middle 95% of the samples ran from 0.35 to 0.65.
- Our sample: its 0.525 sits in the bulk, an ordinary sample. But 38% of the samples came out below 0.50, saying that most counties grew, which is wrong.
Step 5: Change the sample size. With 160 counties per sample, four times as many, the standard error falls to about 0.04, half as much, and the middle 95% narrows to 0.43 to 0.58. Yet about as many as before, 40%, still land below 0.50. The truth is so close to one half that even 160 counties can’t reliably tell which side of a half it is on.
The four questions, answered
- Could it be chance? Yes. Our sample said 0.525, a hair over half, but chance alone moves a sample of 40 by about 0.08, and 4 samples in 10 from this very population say “under half.” One sample of 40 can’t tell us whether most counties shrank. The randomization tests chapter turns this question into a test.
- How big is it? About 0.53, with a standard error of about 0.08: a typical sample of 40 misses the truth by about 8 percentage points. (Here we know the truth, 0.508.)
- Who does it apply to? US counties, all of them, because the 40 were drawn at random from all of them. Not to people: big counties mostly grew, and the counties that shrank held only 22% of Americans in 2017.
- Did one thing cause the other? Not a question here. We measured one thing about each county and compared nothing.
6.6 Looking ahead
This chapter built the vocabulary of inference on populations we could see in full:
- We want to know about parameters but can only compute statistics.
- Statistics vary from sample to sample — this is sampling variability.
- The sampling distribution shows the pattern of that variation.
- The standard error measures its typical size.
Real studies have one sample and a population out of sight. The rest of this part asks what if we did it again? about data like that, by simulation:
- Randomization tests: shuffle the data to see what chance alone produces, and ask whether the observed result stands out.
- Decision errors: what can go wrong when we decide, and how often.
- Bootstrap confidence intervals: what if all you have is your sample? Resample it to see how much the estimate could move.
- Sampling distributions: the shape all these simulations share, and the formulas that predict it without simulating.
The ideas come first; the formulas come at the end of the unit.
6.7 Chapter review
6.7.1 Summary
- A population parameter is a fixed but unknown numerical summary of the population. A sample statistic (point estimate) is computed from data and serves as our best guess of the parameter.
- Different samples from the same population yield different statistics. This is sampling variability — it is not a mistake, but a fundamental feature of working with samples.
- The sampling distribution of a statistic describes how the statistic varies across all possible samples of a given size. It is centered at the parameter, and its spread decreases as sample size increases: four times the data cuts the spread roughly in half. Drawing more samples fills in the picture without narrowing it.
- The standard error is the standard deviation of the sampling distribution. In this unit we find it by simulation. It measures the precision of the statistic as an estimate of the parameter.
- The standard error is not the same as the standard deviation of the data. The standard deviation measures variability of individual observations; the standard error measures variability of a statistic.
6.7.2 Key terms
| Term | Definition |
|---|---|
| Population parameter | A fixed numerical summary of the entire population (e.g., \(p\), \(\mu\)) |
| Sample statistic | A numerical summary computed from sample data (e.g., \(\hat{p}\), \(\bar{x}\)) |
| Point estimate | Another name for sample statistic; our best guess at the parameter |
| Sampling variability | The fact that different samples produce different statistics |
| Sampling distribution | The distribution of a statistic over all possible samples of a given size |
| Standard error (SE) | The standard deviation of the sampling distribution |
6.8 Exercises
Warm-up
Quick practice with the vocabulary and mechanics, before the exercises. Answers are at the end. Each item’s MOM label (e.g. MOM 6.D10) is the same skill with new numbers, for more practice.
(MOM 6.D10) The proportion of all registered voters in Wisconsin who support a ballot measure is 0.52.
Is the numerical value a statistic or a parameter? Explain.
- 0.52 is a statistic because it is a proportion.
- 0.52 is neither a statistic nor a parameter.
- 0.52 is a statistic because it was estimated from polling.
- 0.52 is a parameter (population proportion, p) because it describes the entire population of registered voters in Wisconsin.
(MOM 6.D12) A random sample of 30 runners from the 2017 Cherry Blossom Ten Mile Run had an average finishing time of 98.4 minutes.
Which symbol and label fit the number 98.4 minutes?
- \(\bar{x}\), a statistic
- \(\hat{p}\), a statistic
- \(\mu\), a parameter
- \(p\), a parameter
(MOM 6.D11) A researcher takes a random sample and computes a sample proportion of \(\hat{p}\) = 0.62. If she were to take another random sample of the same size from the same population, she would most likely get:
- A value far from 0.62
- A value of exactly 0.50
- Exactly 0.62 again
- A value close to 0.62 but probably not exactly 0.62, due to sampling variability
(MOM 6.D13) A class uses a simulation to build the sampling distribution of the mean finishing time in samples of runners from the 2017 Cherry Blossom Ten Mile Run. They draw 1,000 samples of size n = 30 and make a histogram of the 1,000 results. Then they try two changes, one at a time:
- Change A: draw 10,000 samples instead of 1,000, still of size n = 30.
- Change B: draw 1,000 samples again, but of size n = 120.
Which change makes the histogram narrower?
- Only change A, the larger number of samples
- Only change B, the larger sample size
- Neither change: the spread depends only on the population
- Both changes, about equally
(MOM 6.D14) A simulation recorded the proportion of women in each of 1,000 random samples of 100 runners from the 2017 Cherry Blossom Ten Mile Run. The standard deviation of the 1,000 results (the standard error) is 0.048.
If every sample were four times as large, about what would the standard deviation of the 1,000 results be?
- About 0.096
- About 0.048
- About 0.012
- About 0.024
Warm-up answers
- (d) 0.52 is a parameter (population proportion, p) because it describes the entire population of registered voters in Wisconsin.
- (a) \(\bar{x}\), a statistic
- (d) A value close to 0.62 but probably not exactly 0.62, due to sampling variability
- (b) Only change B, the larger sample size
- (d) About 0.024
Answers to odd-numbered exercises are provided in the Exercise Solutions appendix at the back of the book.
- Identify the parameter, I. For each of the following situations, state whether the parameter of interest is a mean or a proportion. It may be helpful to examine whether individual responses are numerical or categorical.
In a survey, 100 college students are asked how many hours per week they spend on the Internet.
In a survey, 100 college students are asked: “What percentage of the time you spend on the Internet is part of your course work?”
In a survey, 100 college students are asked whether they cited information from Wikipedia in their papers.
In a survey, 100 college students are asked what percentage of their total weekly spending is on alcoholic beverages.
In a sample of 100 recent college graduates, it is found that 85 percent expect to get a job within one year of their graduation date.
- Identify the parameter, II. For each of the following situations, state whether the parameter of interest is a mean or a proportion.
A poll shows that 64% of Americans personally worry a great deal about federal spending and the budget deficit.
A survey reports that local TV news has shown a 17% increase in revenue within a two year period while newspaper revenues decreased by 6.4% during this time period.
In a survey, high school and college students are asked whether they use geolocation services on their smart phones.
In a survey, smart phone users are asked whether they use a web-based taxi service.
In a survey, smart phone users are asked how many times they used a web-based taxi service over the last year.
- Sample size and the sampling distribution. A researcher plans to estimate the mean sleep hours per night for full-time college students in the U.S. She considers three possible sample sizes: \(n = 25\), \(n = 100\), and \(n = 400\). In each case, she would draw a simple random sample and compute \(\bar{x}\); the sampling distribution describes how \(\bar{x}\) varies across all possible samples of that size.
As \(n\) grows from 25 to 400, what happens to the center of the sampling distribution? Why?
As \(n\) grows from 25 to 400, what happens to the spread (standard error) of the sampling distribution? Give a rough factor: quadrupling \(n\) from 25 to 100 changes the standard error by roughly what?
As \(n\) grows from 25 to 400, what happens to the shape of the sampling distribution (assuming the population is not extremely skewed)? Describe what you would expect to see if you drew the histogram at each sample size.
Which of the three sample sizes gives the most precise estimate of the population mean? Which requires the most resources to collect? Briefly discuss the trade-off.
- Statistic vs. parameter with correct notation. For each described study, identify the population parameter and the sample statistic. For each, state whether it is a mean or a proportion, and write it with the correct symbol.
A national poll of 800 US adults finds that 42% support a proposed carbon tax. The pollster wants to estimate the true percentage of all US adults who support the tax.
A researcher measures the resting heart rate of 60 randomly-selected adult women in a city and finds a sample mean of 71 beats per minute. She wants to estimate the mean resting heart rate for the population of all adult women in the city.
A company tests 200 randomly-selected components off the assembly line and finds 5 defective. The quality engineer wants to estimate the long-run defect rate on this line.
In each of (a)–(c), which of the two — parameter or statistic — is known exactly, and which is being estimated?
- Data distribution or sampling distribution? For each of the following descriptions, decide whether the histogram would show a data distribution (the distribution of individual observations) or a sampling distribution (the distribution of a sample statistic across many samples). Justify each in one sentence.
A histogram of the ages of all 1,200 patients admitted to a hospital ward last year.
A histogram of the mean age from each of 500 random samples of 30 patients drawn from those 1,200.
A dotplot showing the proportion of red beads for each of 400 people, where each person independently scooped a sample of 50 beads from the same bowl.
A histogram of the SAT scores from a random sample of 250 high-school seniors.
Which of the four would typically be narrower — a data distribution or a sampling distribution built from the same population? Explain in one sentence.
- Reading a sampling distribution. The histogram below was built by drawing 1,000 random samples of size \(n = 40\) from a large population and recording the sample proportion \(\hat{p}\) (the proportion of “yes” responses to a survey question) for each. The true population proportion is \(p = 0.50\).
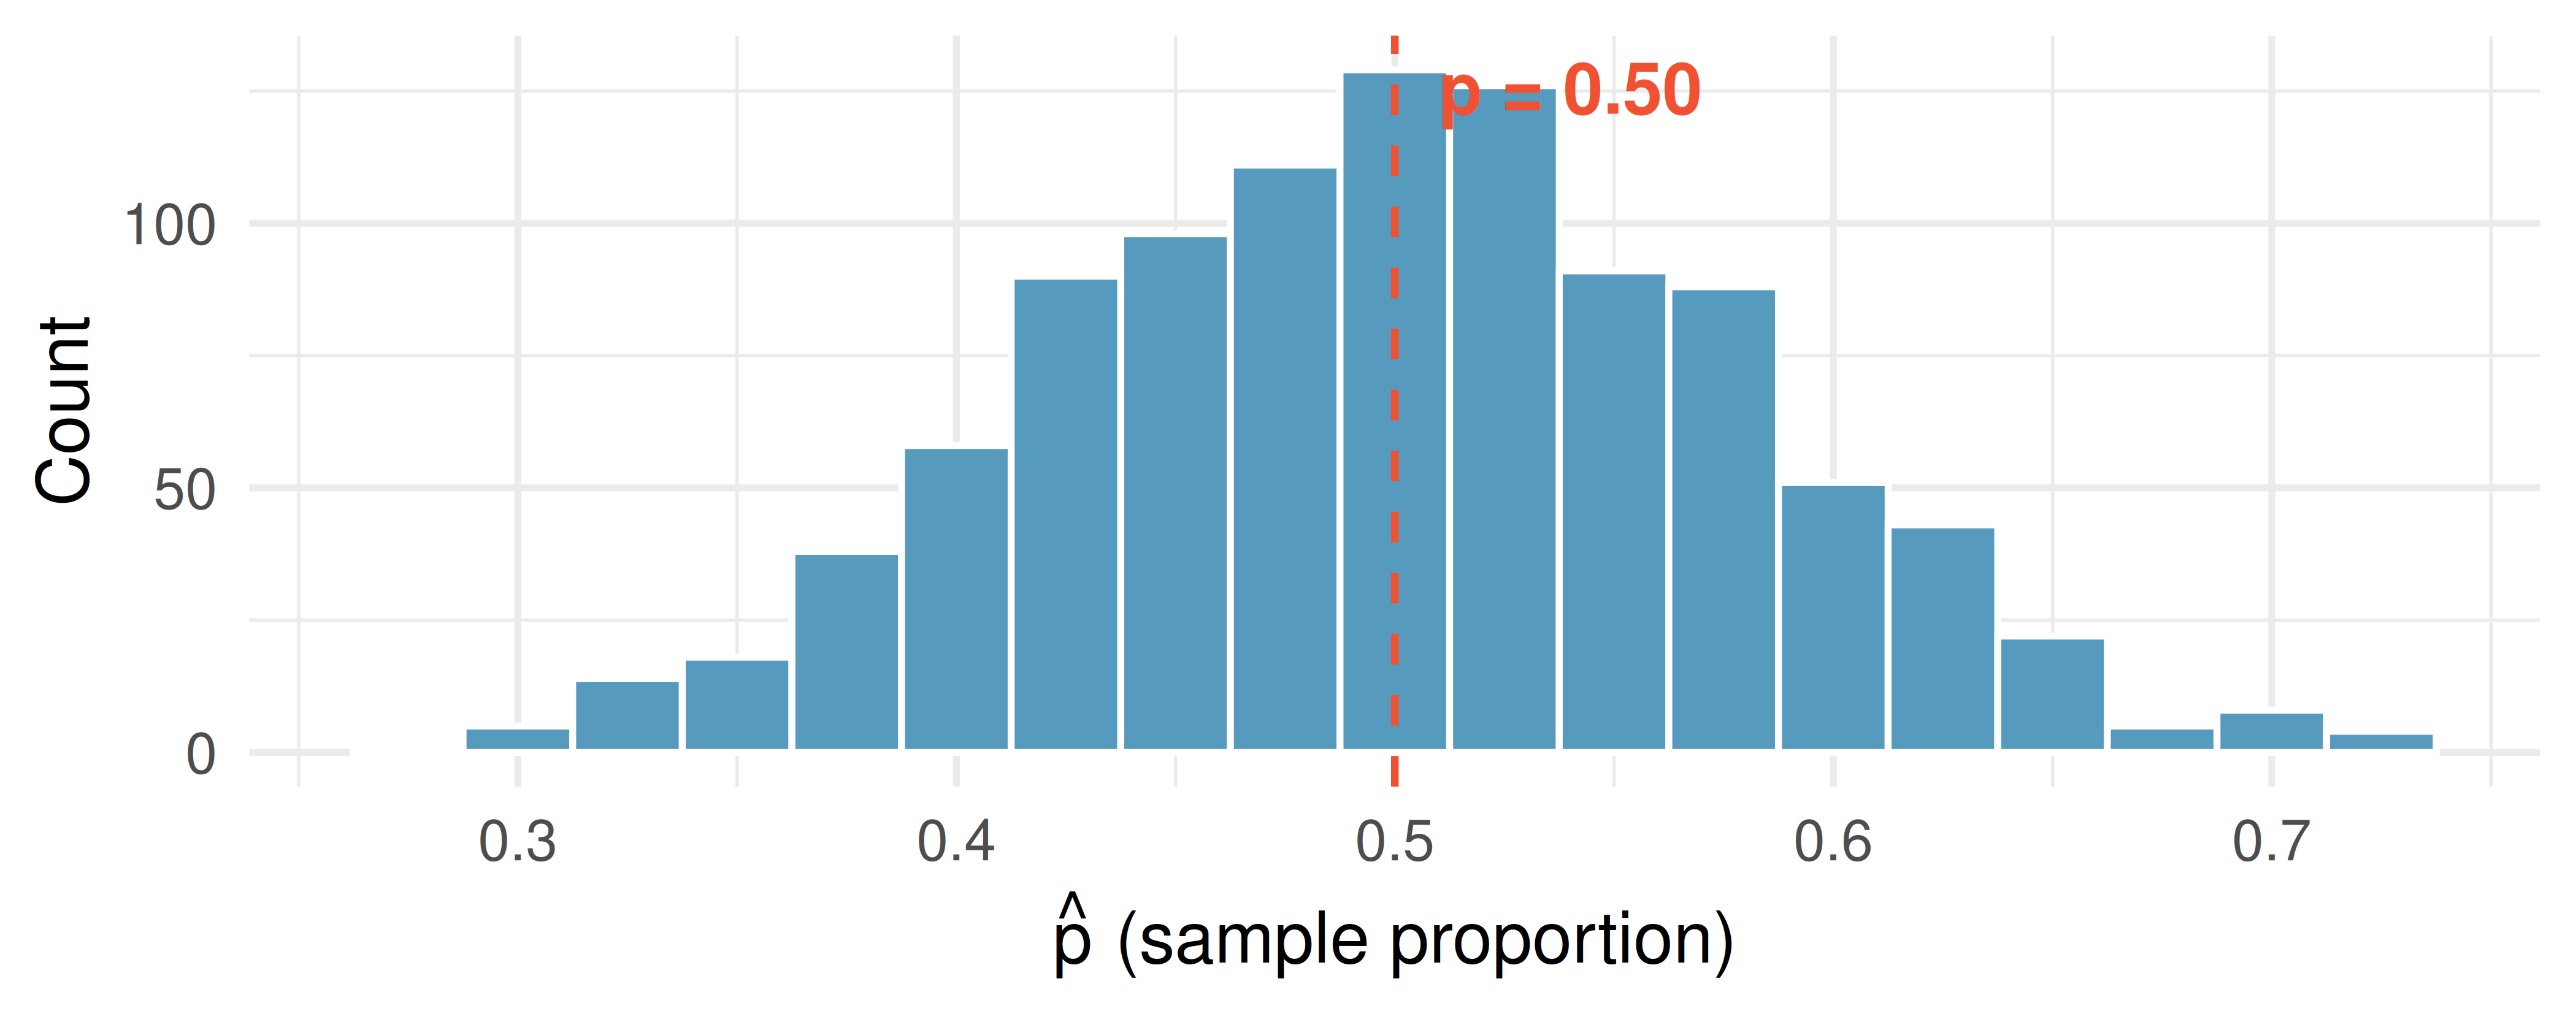
Where is the sampling distribution centered? How does that compare to the true \(p\)?
Describe the shape of the sampling distribution.
Estimate the standard error of \(\hat{p}\) by eyeballing the picture. (Recall: the SE is the standard deviation of the sampling distribution — roughly, the typical distance from the center.)
Suppose the samples were instead of size \(n = 160\) (four times as large). Describe how the picture would change. In particular, roughly what would the new standard error be?
↗ Try this yourself — the Sampling Distribution Lab lets you regenerate this picture live and drag the sliders to see what happens at other \(n\) or \(p\).
- Standard deviation vs. standard error. A study of 400 college students reports sample mean sleep \(\bar{x} = 6.8\) hours per night, sample standard deviation \(s = 1.4\) hours, and standard error of the mean \(\text{SE}(\bar{x}) = 0.07\) hours. For each of the following statements, decide whether \(s\) or \(\text{SE}(\bar{x})\) is the appropriate number, and explain briefly.
“In this sample, a typical student’s sleep is within a few hours of 6.8.”
“If we drew a fresh sample of 400 college students and recomputed the mean, the new \(\bar{x}\) would typically be within a tenth of an hour of the true population mean.”
A researcher writes: “The variability in sleep hours across students in this sample is about 1.4 hours.” Is she describing \(s\) or \(\text{SE}(\bar{x})\)?
Explain why \(\text{SE}(\bar{x})\) is so much smaller than \(s\) for this study.
- What a reported standard error tells you. A national polling firm surveys 1,067 US adults and reports that 51% support a particular ballot measure, with a margin of error of \(\pm 3\) percentage points at 95% confidence (which corresponds roughly to \(2 \cdot \text{SE} \approx 0.03\), i.e., \(\text{SE} \approx 0.015\)).
If the firm’s polling procedure were repeated many times with fresh random samples of 1,067 adults, roughly what would a picture of all their \(\hat{p}\) values look like? Describe the center and spread.
Would you be surprised if a different firm, using the same methodology and a fresh sample of 1,067 adults, reported 48% support? What about 40% support? Explain each briefly using the SE.
Suppose the firm doubled its sample size to about 2,134 adults. Roughly what would the new SE and margin of error become? (Hint: SE scales like \(1/\sqrt{n}\), so doubling \(n\) multiplies SE by \(1/\sqrt{2} \approx 0.71\).)
A political commentator sees the poll and writes: “Support is definitely between 48% and 54%.” What’s wrong with the word definitely?
- Match the sampling distributions. Below are four histograms, each built by drawing 1,000 random samples and recording the sample proportion \(\hat{p}\) each time. They come from four different \((n, p)\) combinations:
- \((n = 25, \, p = 0.20)\)
- \((n = 100, \, p = 0.20)\)
- \((n = 25, \, p = 0.50)\)
- \((n = 100, \, p = 0.50)\)
Match each panel (A, B, C, D) to its combination, using only what you can see. Then briefly justify each match in one sentence: what feature of the picture told you center (relates to \(p\)) versus spread (relates to \(n\))?
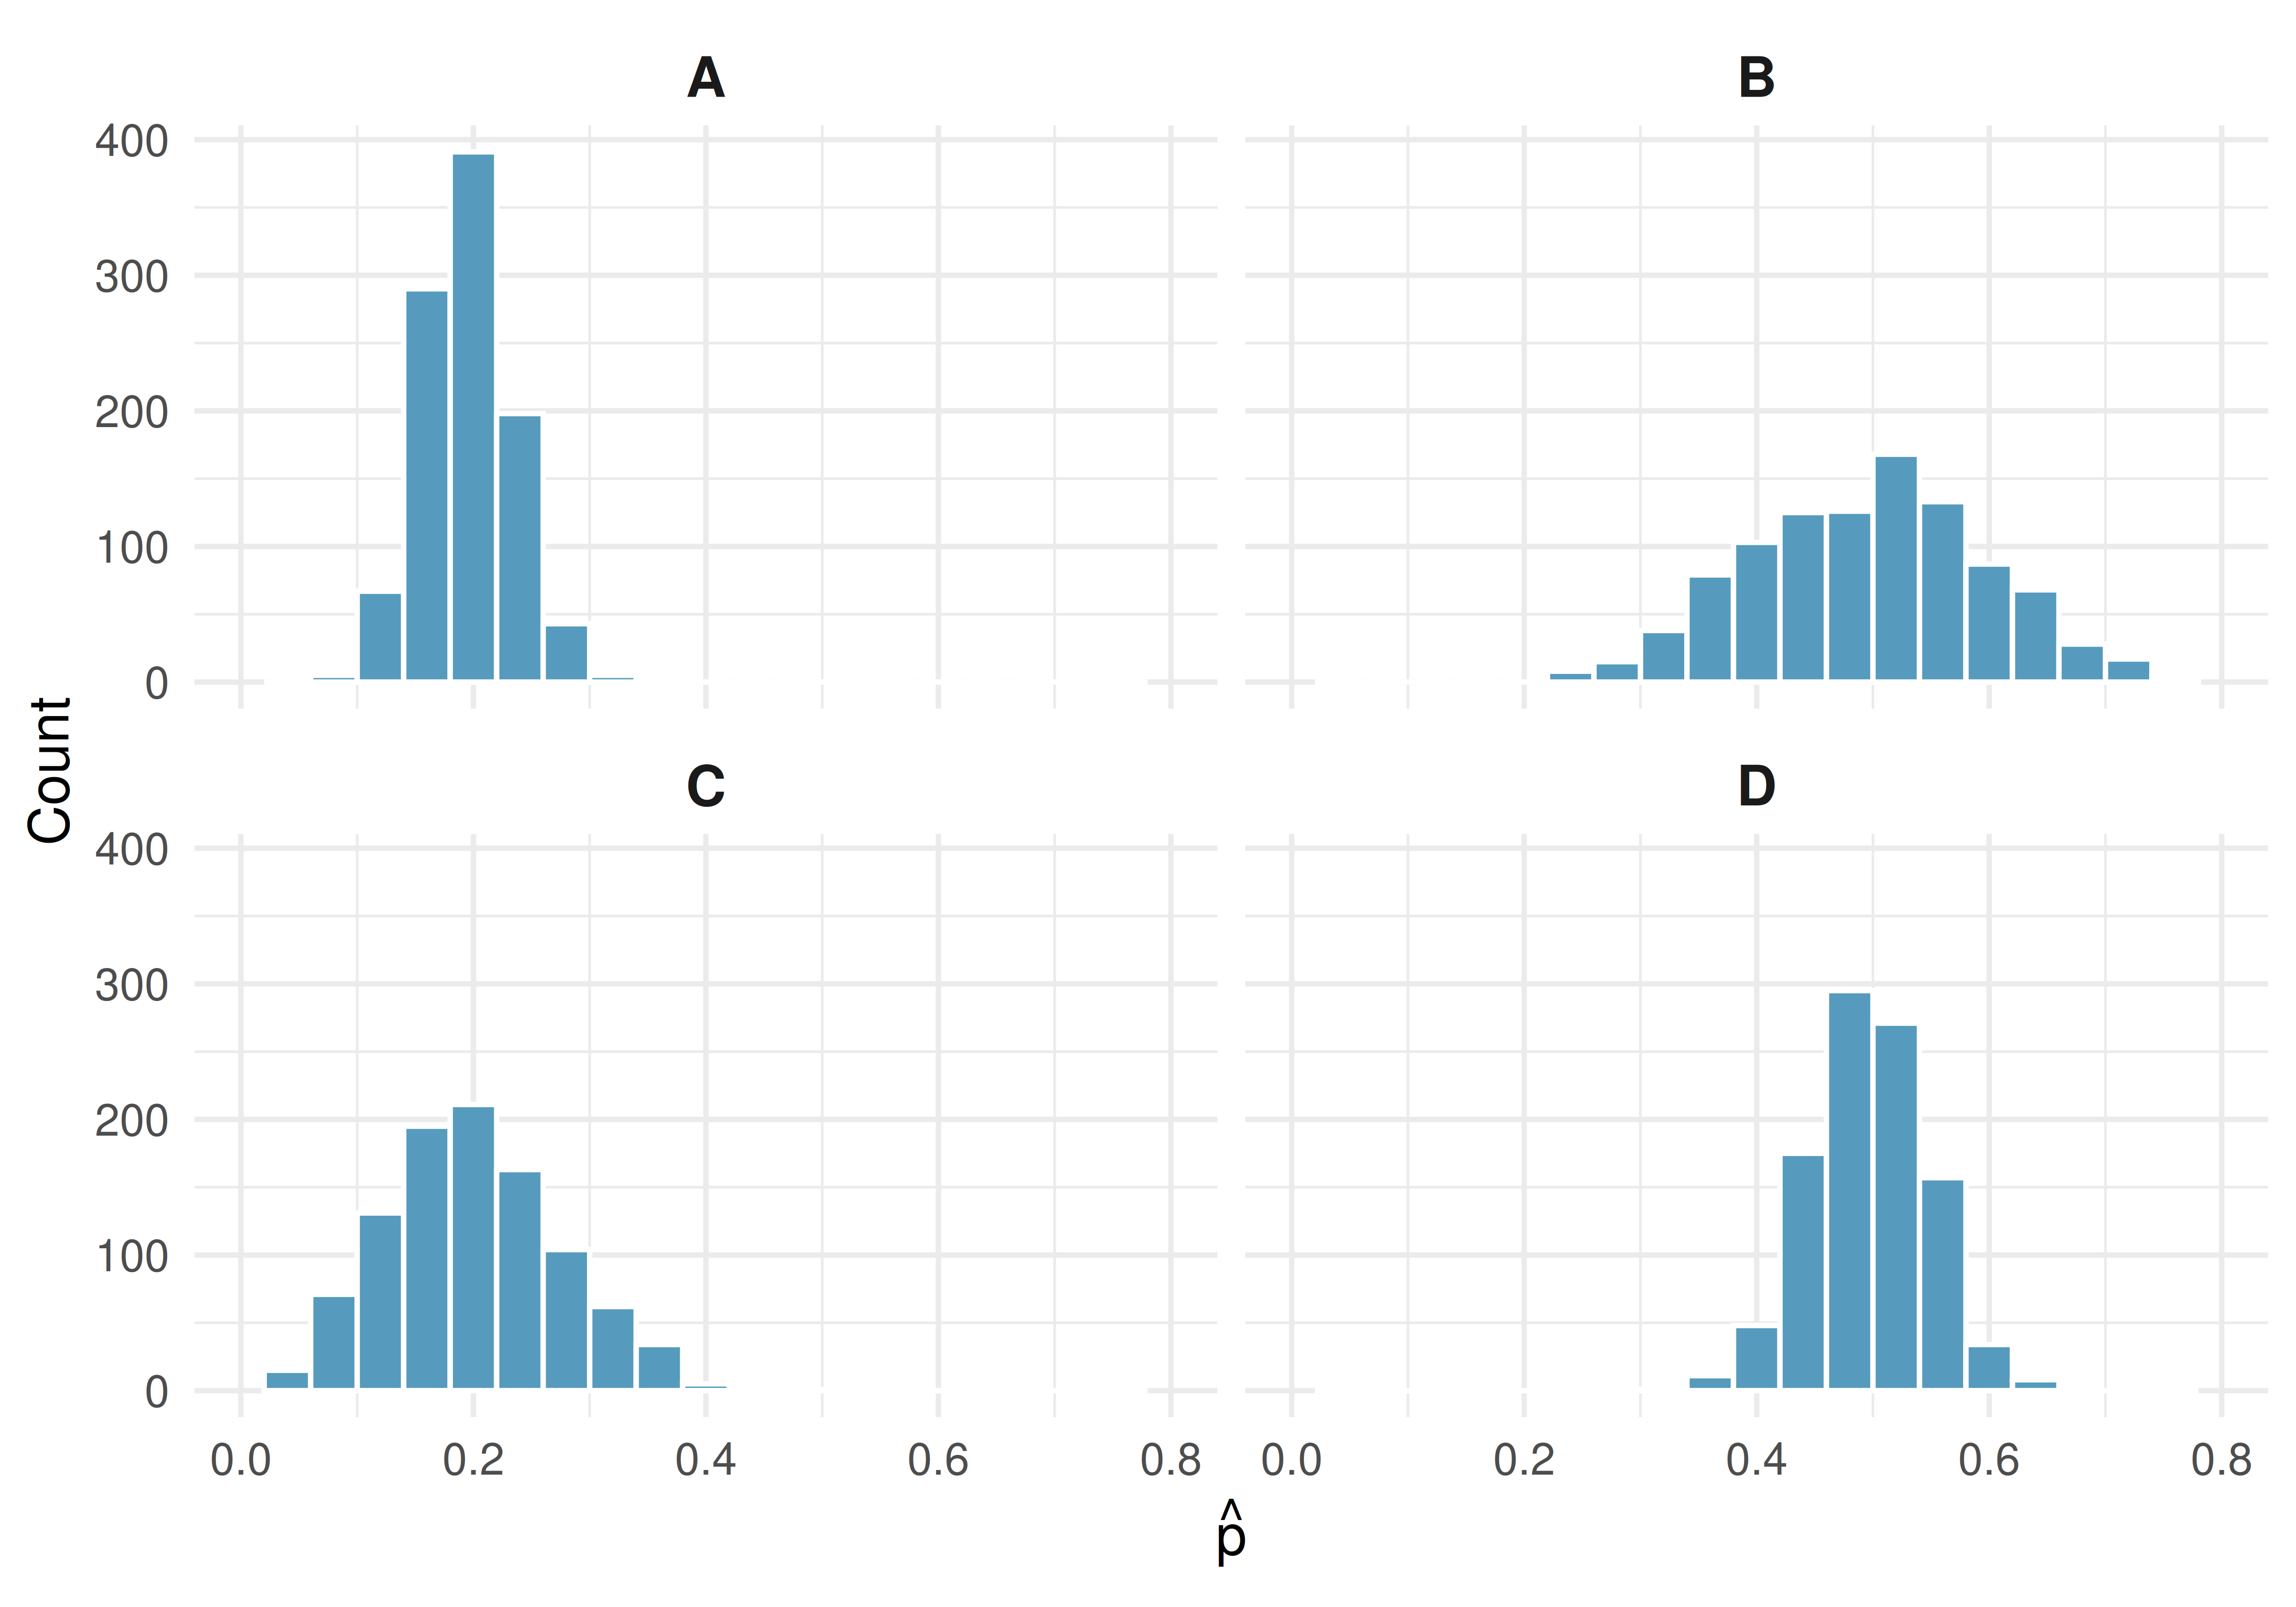
↗ Try this yourself — in the Sampling Distribution Lab, drive the \(n\) and \(p\) sliders to any of the four combos and watch the histogram redraw. Does it match the panel you assigned it to?
- Estimate the standard error from a dot plot. The dot plot below shows the sample means \(\bar{x}\) from 50 random samples of 30 college students each. In each sample, the researcher measured hours of sleep per night; the population mean is \(\mu = 7.0\) hours.
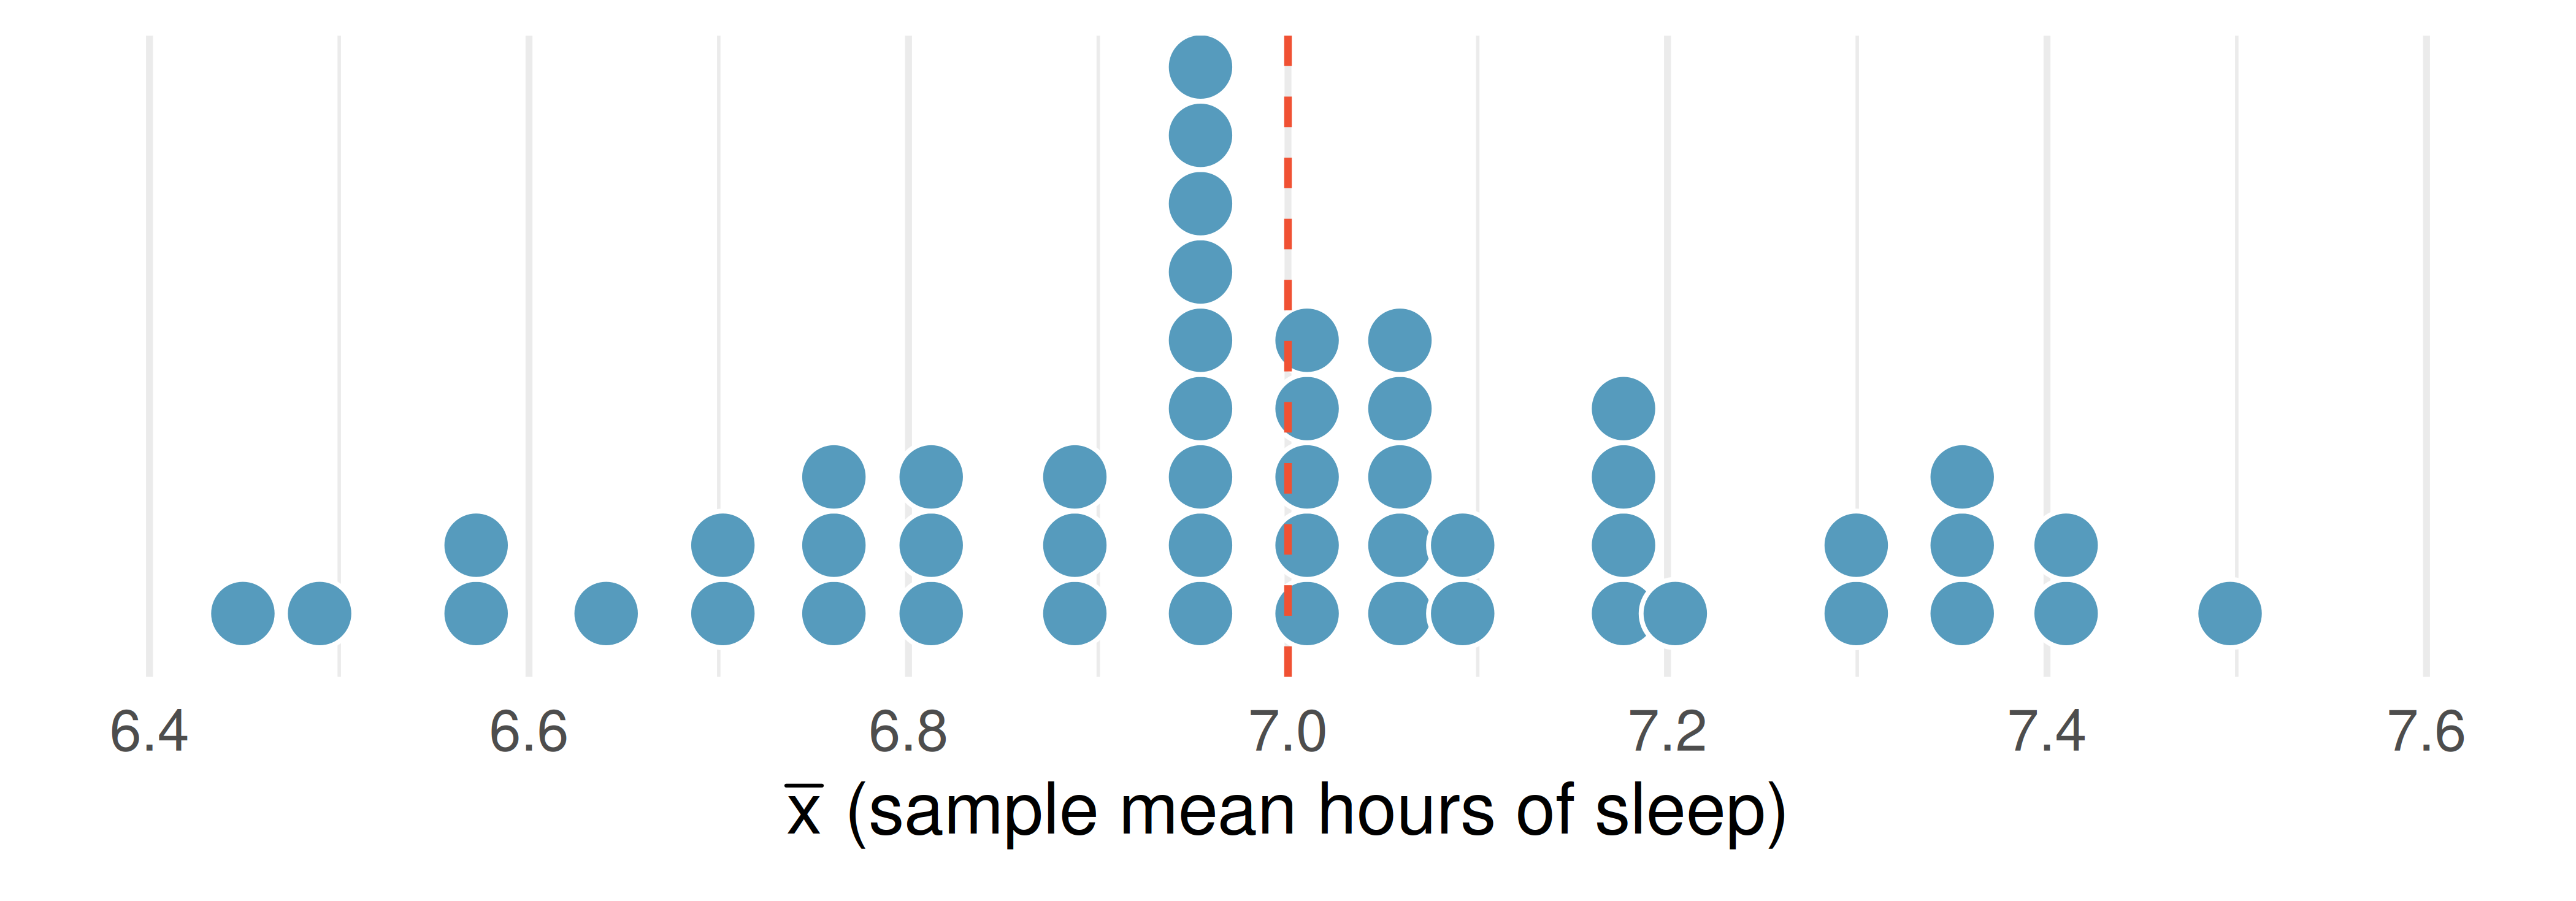
Where is the sampling distribution of \(\bar{x}\) centered? How does that compare to the population mean \(\mu = 7.0\)?
Recall: the standard error of \(\bar{x}\) is the standard deviation of the sampling distribution — roughly, the typical distance of a dot from the center. Estimate the SE from the picture. (A rough eyeball: the range from lowest to highest dot spans about \(\pm 2\) SE if the shape is roughly bell-shaped.)
A student computes the standard error using the population SD \(\sigma = 1.4\) hours: \(\sigma / \sqrt{n} = 1.4 / \sqrt{30} \approx 0.26\). How does that compare to your visual estimate in (b)?
If the researcher had drawn samples of size \(n = 120\) instead of \(n = 30\), how would the width of this dot plot change? Give a rough factor.
↗ Try this yourself — the Sampling Distribution Lab builds the same kind of picture from a bell-shaped population (its own \(\mu\) and \(\sigma\), not the sleep values); draw samples at \(n = 30\), then drive \(n\) up to 120 and watch the spread shrink.
StatLens Exercises
These exercises focus on the ideas behind sampling variability: telling a parameter from a statistic, a sampling distribution from a data distribution, and reading the standard error. Where a link is given, let StatLens do the simulating and spend your effort on the reasoning.
Parameter or statistic? A university has 14,000 undergraduates. A researcher surveys a random sample of 200 of them and finds that 132 work at least 10 hours a week.
- Identify the population and the sample.
- Is the value \(132/200 = 0.66\) a parameter or a statistic? Give its symbol.
- Is the true fraction of all 14,000 undergraduates who work 10+ hours a parameter or a statistic? Give its symbol. Is its value known?
Sampling distribution vs. data distribution. A nurse records the resting heart rate of every patient in a large clinic, then also computes the mean heart rate of each day’s batch of 40 patients over many days.
- Which collection of numbers forms a data distribution — the individual heart rates, or the daily means?
- Which forms a sampling distribution?
- Which of the two distributions has the larger spread, and why?
Predict, then check: two different knobs. You saw the effect of sample size on the sampling distribution in the three-panel figure earlier in this chapter (all three centered at \(p = 0.60\), spread shrinking as \(n\) grew). Now drive it yourself: first, write your predictions; then open the Sampling Distribution Simulator and choose the right-skewed population.
- Predict the shape of the sampling distribution of \(\bar{x}\) for \(n = 5\) (as skewed as the population, less skewed, or symmetric?). Then set \(n = 5\), draw many samples, and compare to your prediction.
- With \(n = 5\) still set, draw even more samples. Does the spread shrink, or does the distribution just fill in? Now switch to \(n = 50\). Which of the two actions — more samples or larger \(n\) — changed the spread?
- The tool shows the theoretical standard error \(\sigma/\sqrt{n}\) and the observed SD of the sample means. Why should these two numbers be close?
Interpret the standard error. A polling firm estimates support for a ballot measure from a random sample and reports \(\hat{p} = 0.47\) with a standard error of \(0.02\).
- In plain language, what does the standard error of \(0.02\) tell you?
- Roughly how far from the true proportion might \(\hat{p}\) reasonably be? (Use the “\(\pm 2\,SE\)” idea.)
- The firm wants to halve the standard error for its next poll. By what factor must it increase the sample size, and why?
Spot the mistake. A student writes: “I took one sample of 60 students and got \(\bar{x} = 7.1\) hours of sleep. The standard error was 0.3, so 95% of students sleep between about 6.5 and 7.7 hours.”
- What has the student confused?
- What does the interval \(7.1 \pm 2(0.3)\) actually describe?