Tech Tutorial — Simulate. This unit’s tools build a sampling distribution by resampling — shuffling for a hypothesis test, bootstrapping for a confidence interval. Pick one tool and follow its tab.
StatLens — purpose-built for resampling; the natural home for this unit.
R — the infer package mirrors the same logic in code.
Jamovi — its standard menus do not do randomization/bootstrap (see its tab).
We reuse the class survey from the Explore tutorial: class_survey.csv.
What you’ll do
A randomization test — is mean commute_min different for On- vs. Off-campus students?
A bootstrap confidence interval — estimate the mean sleep_hours.
1. Randomization test for a difference in means
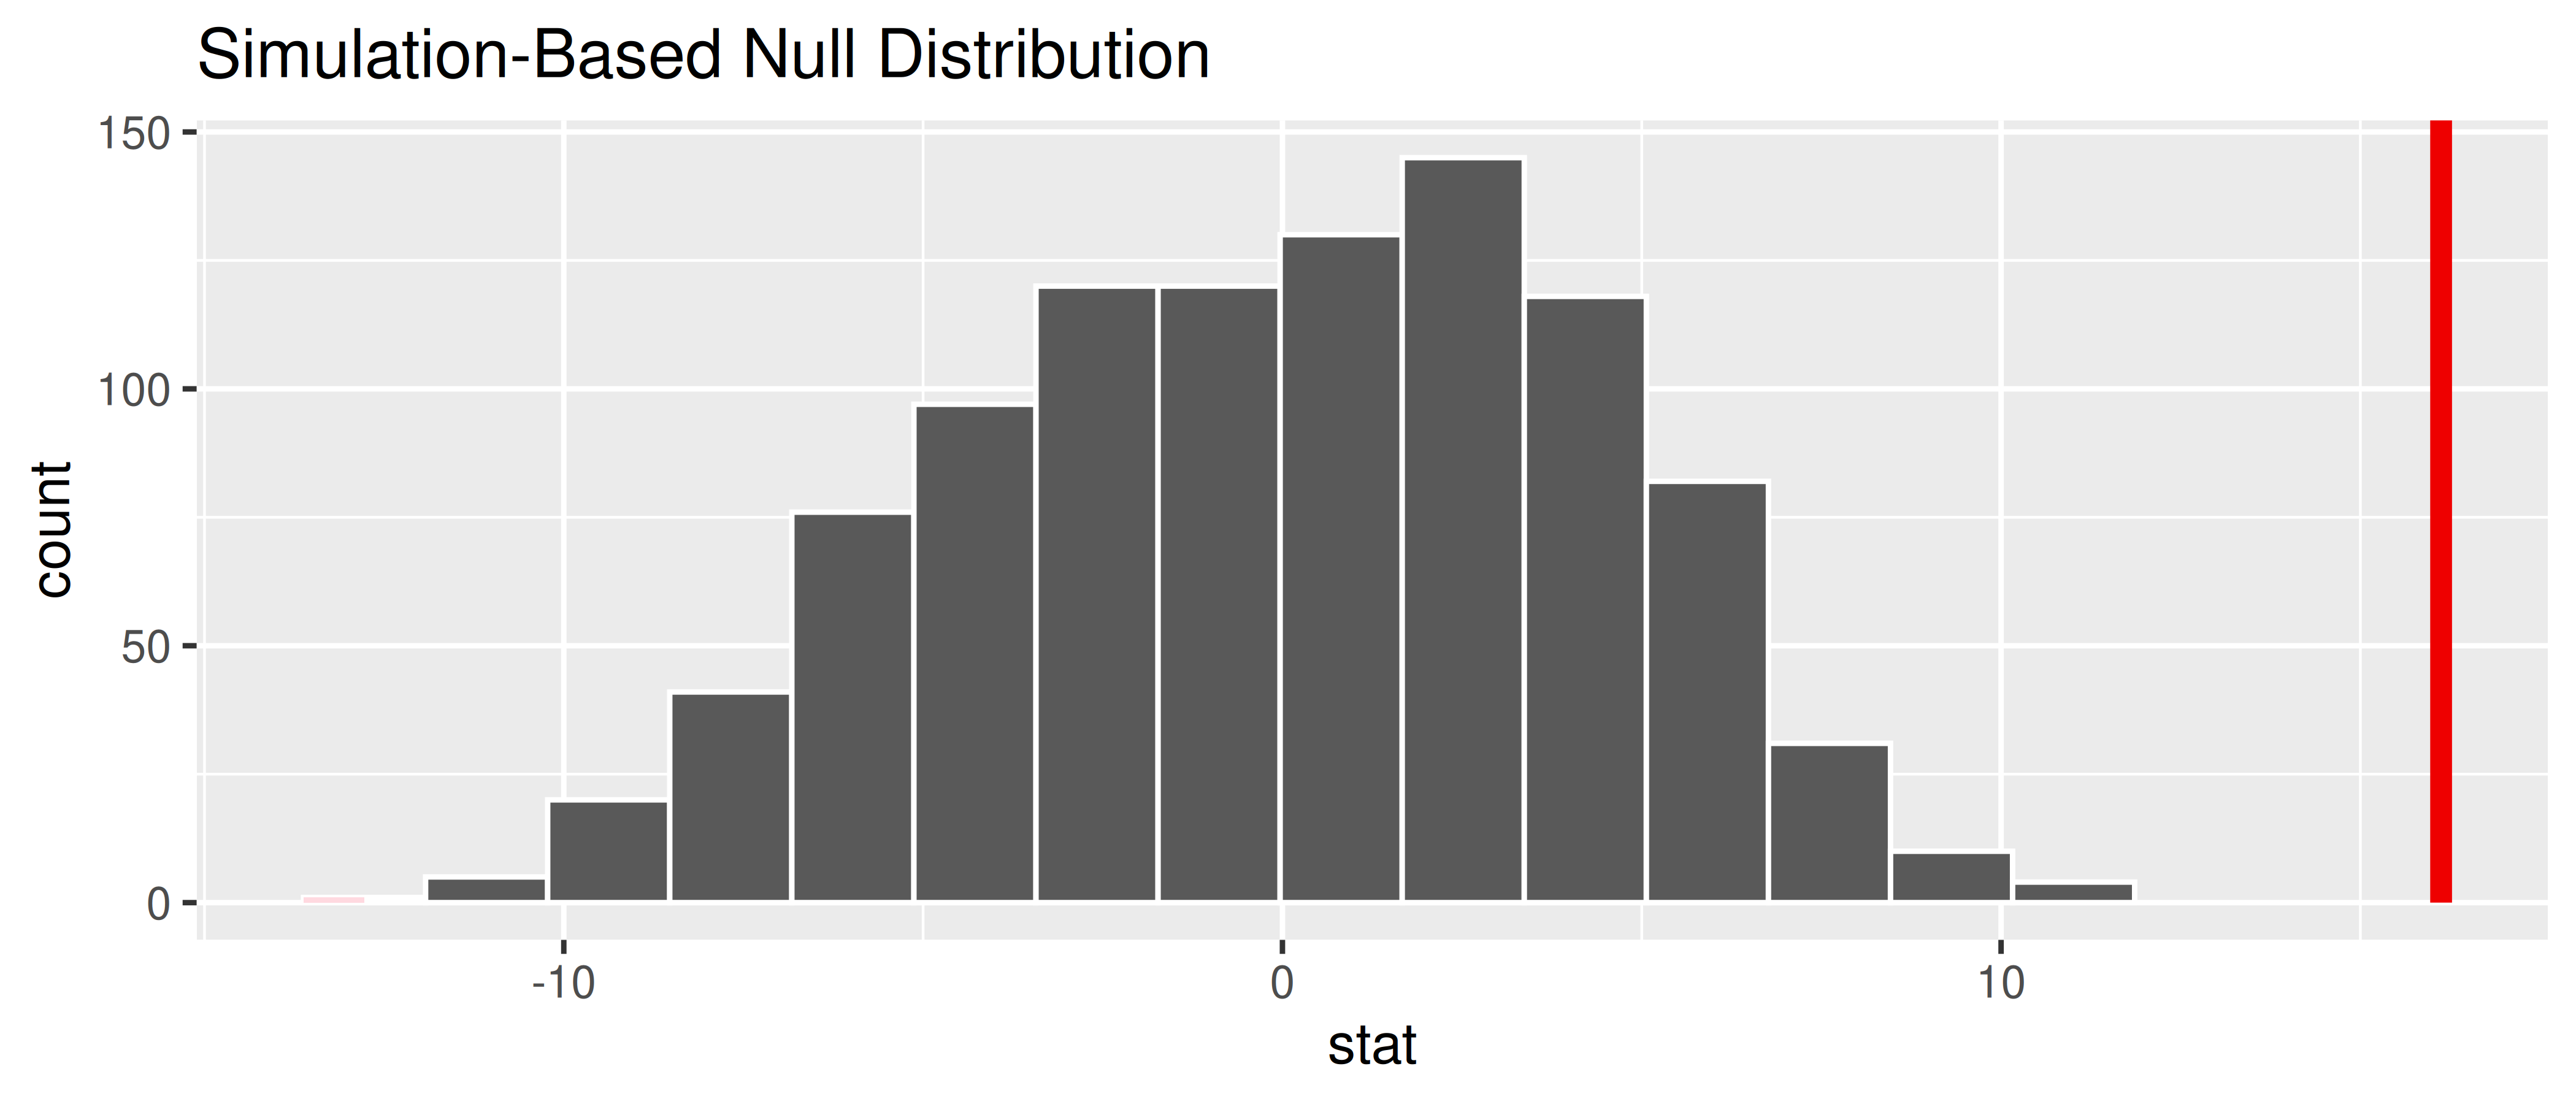
We ask whether on-campus and off-campus students differ in mean one-way commute. The null says housing doesn’t matter, so any labeling of students as on/off-campus is interchangeable. We shuffle the housing labels many times to build the null distribution of the difference in means, then see where the observed difference falls.
Set the response to commute_min and the grouping variable to housing.
Generate ~1000 shuffles. Read the p-value — the share of shuffles at least as extreme as the observed difference.
library(readr)library(dplyr)library(infer)library(ggplot2)survey <-read_csv("../datasets/class_survey.csv")obs_diff <- survey |>specify(commute_min ~ housing) |>calculate(stat ="diff in means", order =c("Off-campus", "On-campus"))null_dist <- survey |>specify(commute_min ~ housing) |>hypothesize(null ="independence") |>generate(reps =1000, type ="permute") |>calculate(stat ="diff in means", order =c("Off-campus", "On-campus"))null_dist |>get_p_value(obs_stat = obs_diff, direction ="two-sided")
# A tibble: 1 × 1
  p_value
    <dbl>
1       0
null_dist |>visualize() +shade_p_value(obs_stat = obs_diff, direction ="two-sided")
Randomization (null) distribution of the difference in mean commute. The observed difference sits far in the tail.
Jamovi: built-in menus don’t shuffle
Jamovi’s built-in menus don’t run randomization (permutation) tests — a general permutation test on your data needs the StatLens tab (no install) or the R tab. (Add-on modules such as esci give menu-driven sampling-variability demos, but not a permutation p-value.) Jamovi returns in force in the next unit, Calculate, with the formula-based version of this comparison — a two-sample t-test.
2. Bootstrap confidence interval for a mean
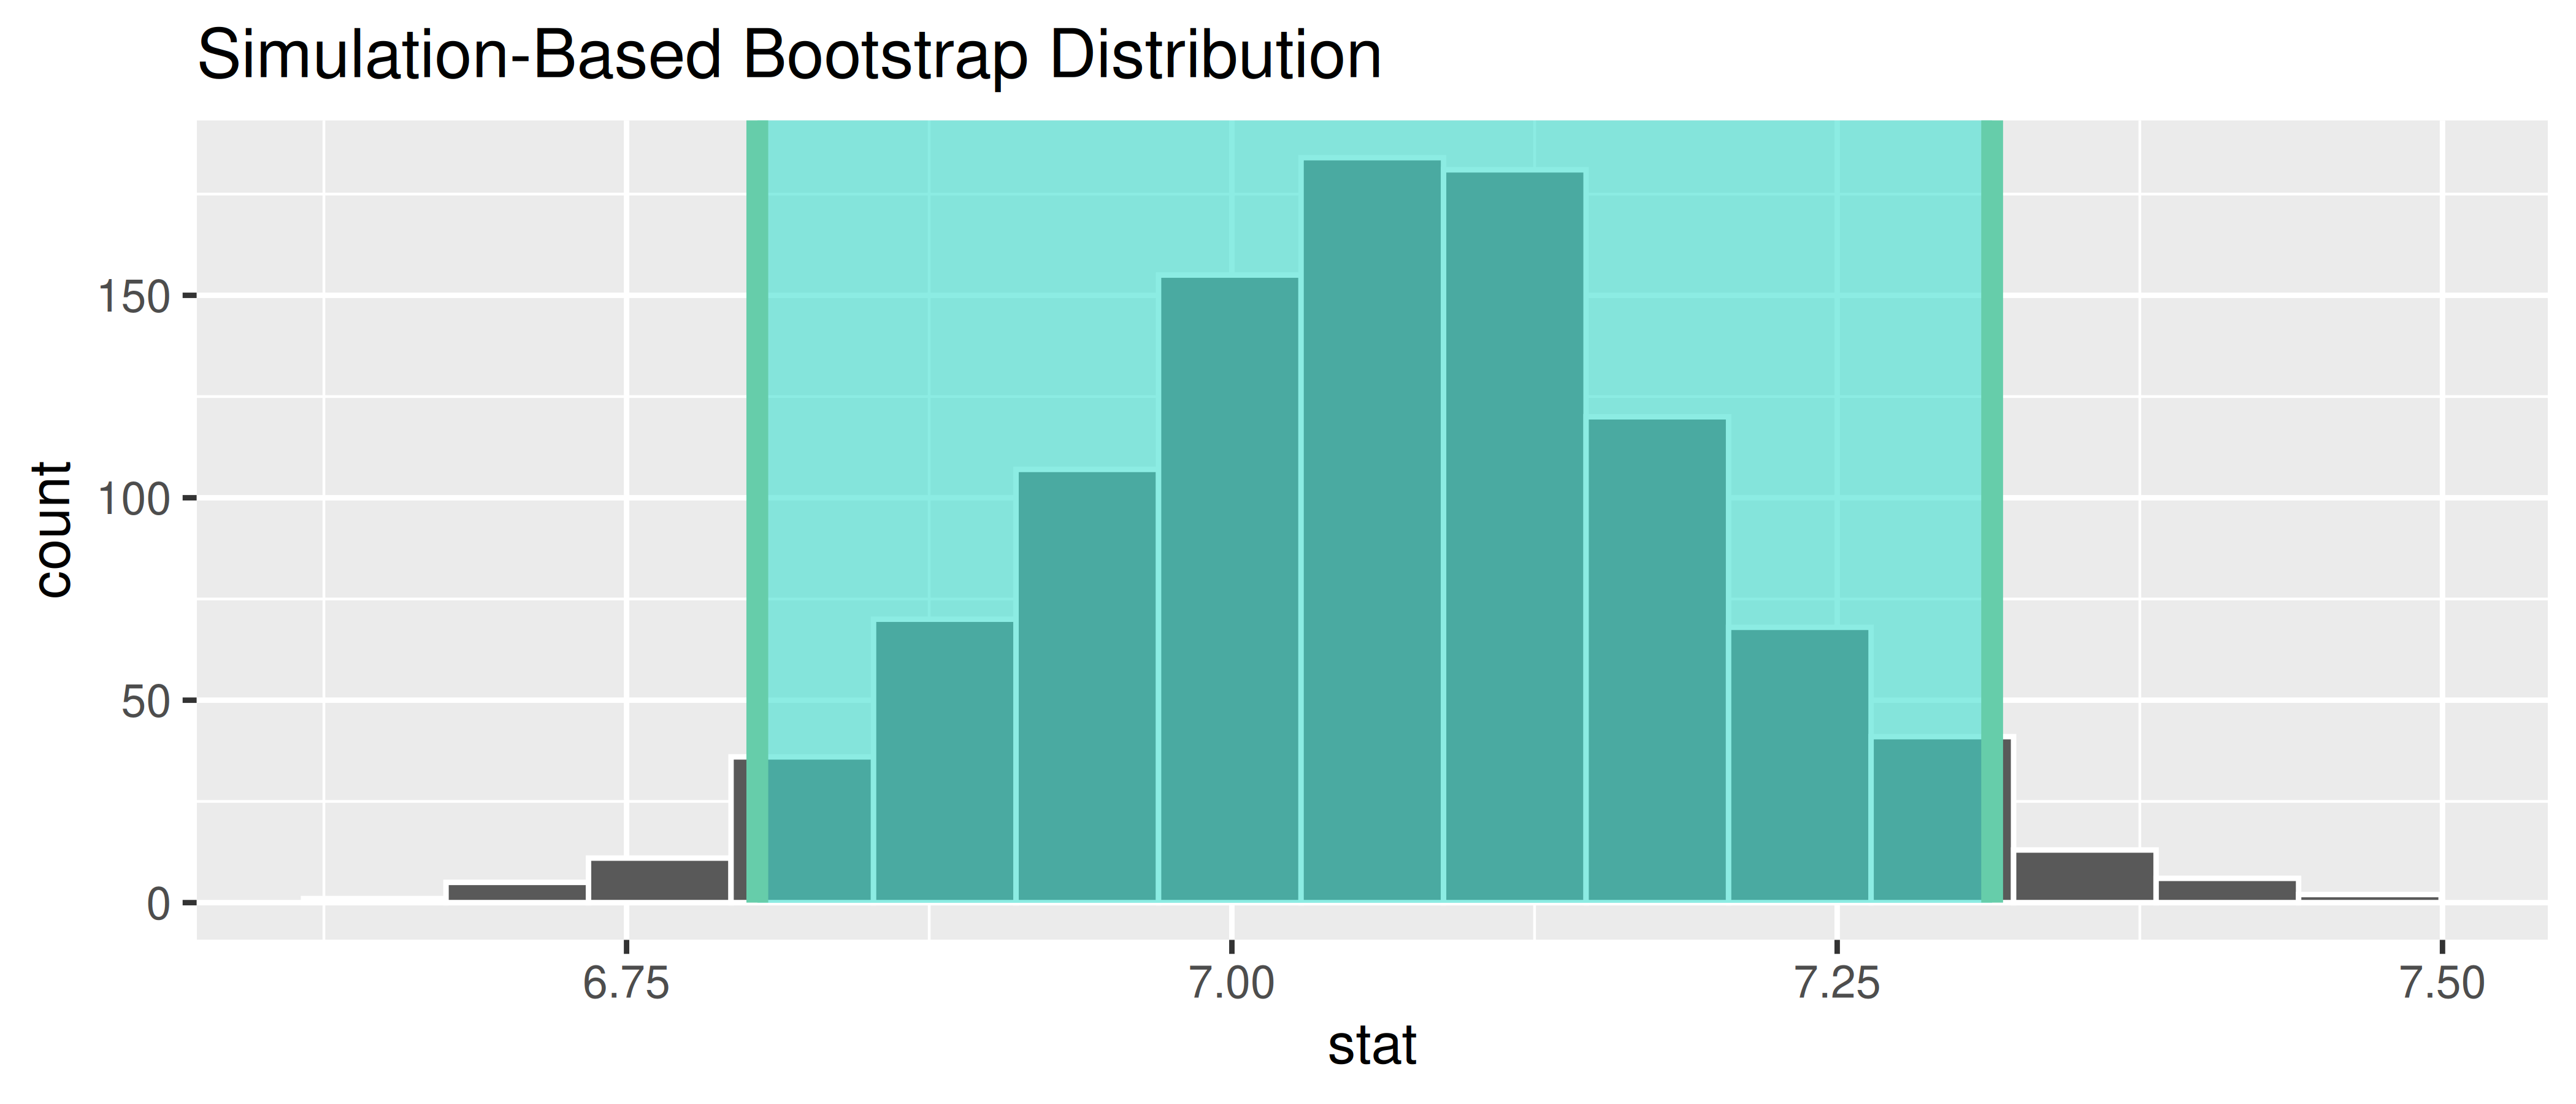
To estimate the mean nightly sleep with a margin of error, we bootstrap: resample the data with replacement many times, record each resample’s mean, and take the middle 95% of those means as the interval.
Bootstrap distribution of the mean sleep hours, with the 95% percentile interval shaded.
Jamovi: bootstrapping needs a module
A bootstrap CI for a plain mean isn’t in Jamovi’s built-in menus — use the StatLens or R tab. (The esci add-on does menu-driven interval estimation and the “dance of the means”; GAMLj does true bootstrap CIs for regression/ANOVA models.) In the Calculate unit, Jamovi produces the formula-based one-sample t interval for this same mean.
Check yourself
Going further in R (optional)
OpenIntro IMS interactive tutorials for this unit (same infer style as above):